

Question: Please show steps to finding the answer Data Table the ans Click on the following icon in order to copy its contents into a spreadsheet.)
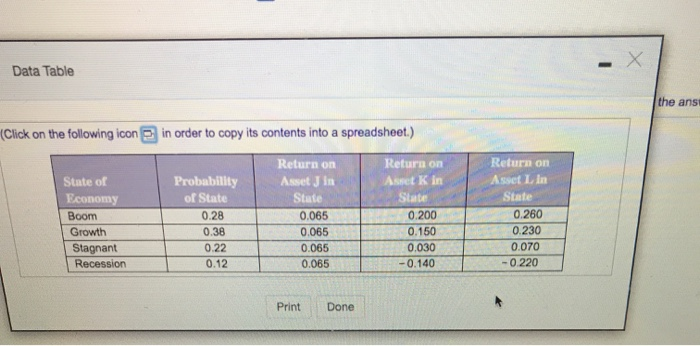
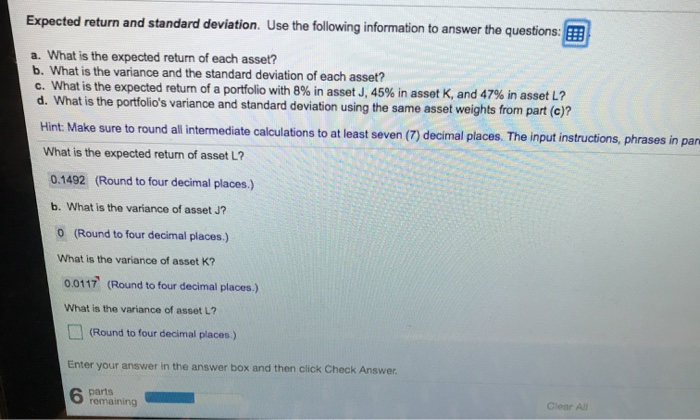
Data Table the ans Click on the following icon in order to copy its contents into a spreadsheet.) State of Economy Boom Growth Stagnant Recession Probability of State 0.28 0.38 0.22 0.12 Return on Asset Jin State 0.065 0.065 0.065 0.065 1 Return on Aset Kin State 0 .200 0.150 0.030 -0.140 Return on Asset I In State 0.260 0.230 0.070 -0.220 Print Done Expected return and standard deviation. Use the following information to answer the questions: a. What is the expected return of each asset? b. What is the variance and the standard deviation of each asset? c. What is the expected return of a portfolio with 8% in asset J, 45% in asset K, and 47% in asset L? d. What is the portfolio's variance and standard deviation using the same asset weights from part (c)? Hint: Make sure to round all intermediate calculations to at least seven (7) decimal places. The input instructions, phrases in par What is the expected return of asset L? 0.1492 (Round to four decimal places.) b. What is the variance of asset J? O(Round to four decimal places.) What is the variance of asset K? 0.0117 (Round to four decimal places.) What is the variance of asset L? (Round to four decimal places) Enter your answer in the answer box and then click Check Answer. parts O remaining
Step by Step Solution
There are 3 Steps involved in it

Get step-by-step solutions from verified subject matter experts