

Question: please show table so that I can answer the next part Sales of tablet computers at Ted Glickman's electronics store in Washington, DC over the
please show table so that I can answer the next part
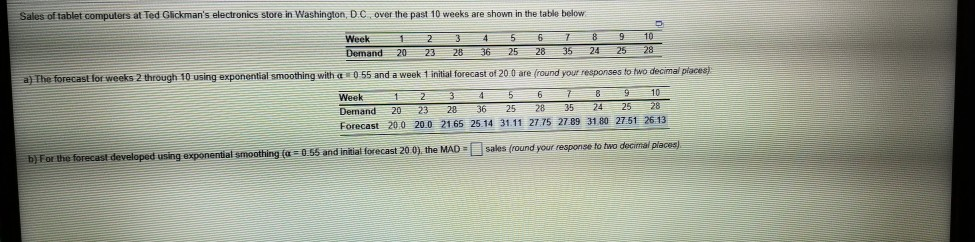
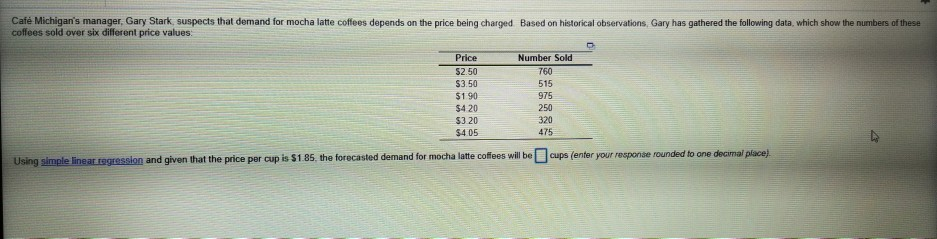
Sales of tablet computers at Ted Glickman's electronics store in Washington, DC over the past 10 weeks are shown in the table below Week 1 2 3 4 5 6 7 8 9 10 Demand 2023 28 36 25 28 35 24 25 28 a) The forecast for weeks 2 through 10 using exponential smoothing with 55 and a week 1 initial forecast of 200 are (round your responses to two decimal places) Week 1 3 E5 6 7 8 9 10 Demand 20 23 28 36 25 28 3524 2528 Forecast 20 0 20.0 2165 25.14 31.11 27.75 27 89 31 80 27.51 26 13 b) For the forecast developed using exponential smoothing (a=0.55 and initial forecast 20.0), the MAD- sales (round your response to two decimal places) Caf Michigan's manager, Gary Stark, suspects that demand for mocha latte coffees depends on the price being charged Based on historical observations, Gary has gathered the following data, which show the numbers of these coffees sold over six different price values Number Sold 515 Price $2.50 $350 $190 $420 $320 $4.05 975 250 320 475 Using simple linear agression and given that the price per cup is $185, the forecasted demand for mocha latte coffees will be cups (enter your responde rounded to one decinal place)Step by Step Solution
There are 3 Steps involved in it
1 Expert Approved Answer
Step: 1 Unlock

Question Has Been Solved by an Expert!
Get step-by-step solutions from verified subject matter experts
Step: 2 Unlock
Step: 3 Unlock