

Question: Please show the answer solved in Excel. Thank you You have the following comparative cost per unit of service performance data with which to prepare
 Please show the answer solved in Excel. Thank you
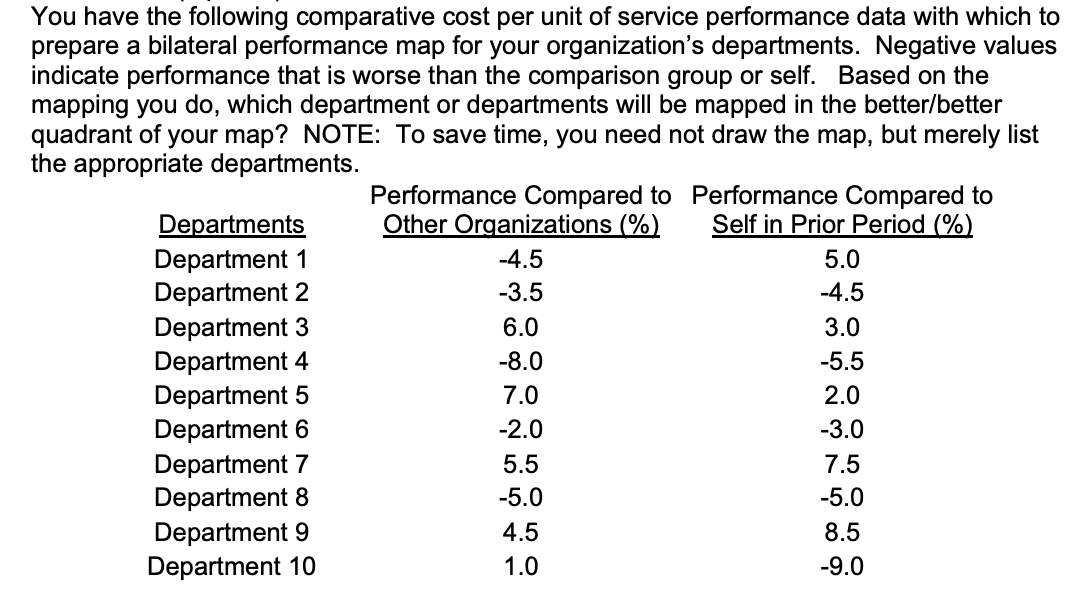
You have the following comparative cost per unit of service performance data with which to prepare a bilateral performance map for your organization's departments. Negative values indicate performance that is worse than the comparison group or self. Based on the mapping you do, which department or departments will be mapped in the better/better quadrant of your map? NOTE: To save time, you need not draw the map, but merely list the appropriate departments
Step by Step Solution
There are 3 Steps involved in it
1 Expert Approved Answer
Step: 1 Unlock

Question Has Been Solved by an Expert!
Get step-by-step solutions from verified subject matter experts
Step: 2 Unlock
Step: 3 Unlock