

Question: Please show the calculation process in Excel, thank you 9. With a smoothing constant of a = 0.2, equation (8.7) shows that the forecast for
Please show the calculation process in Excel, thank you
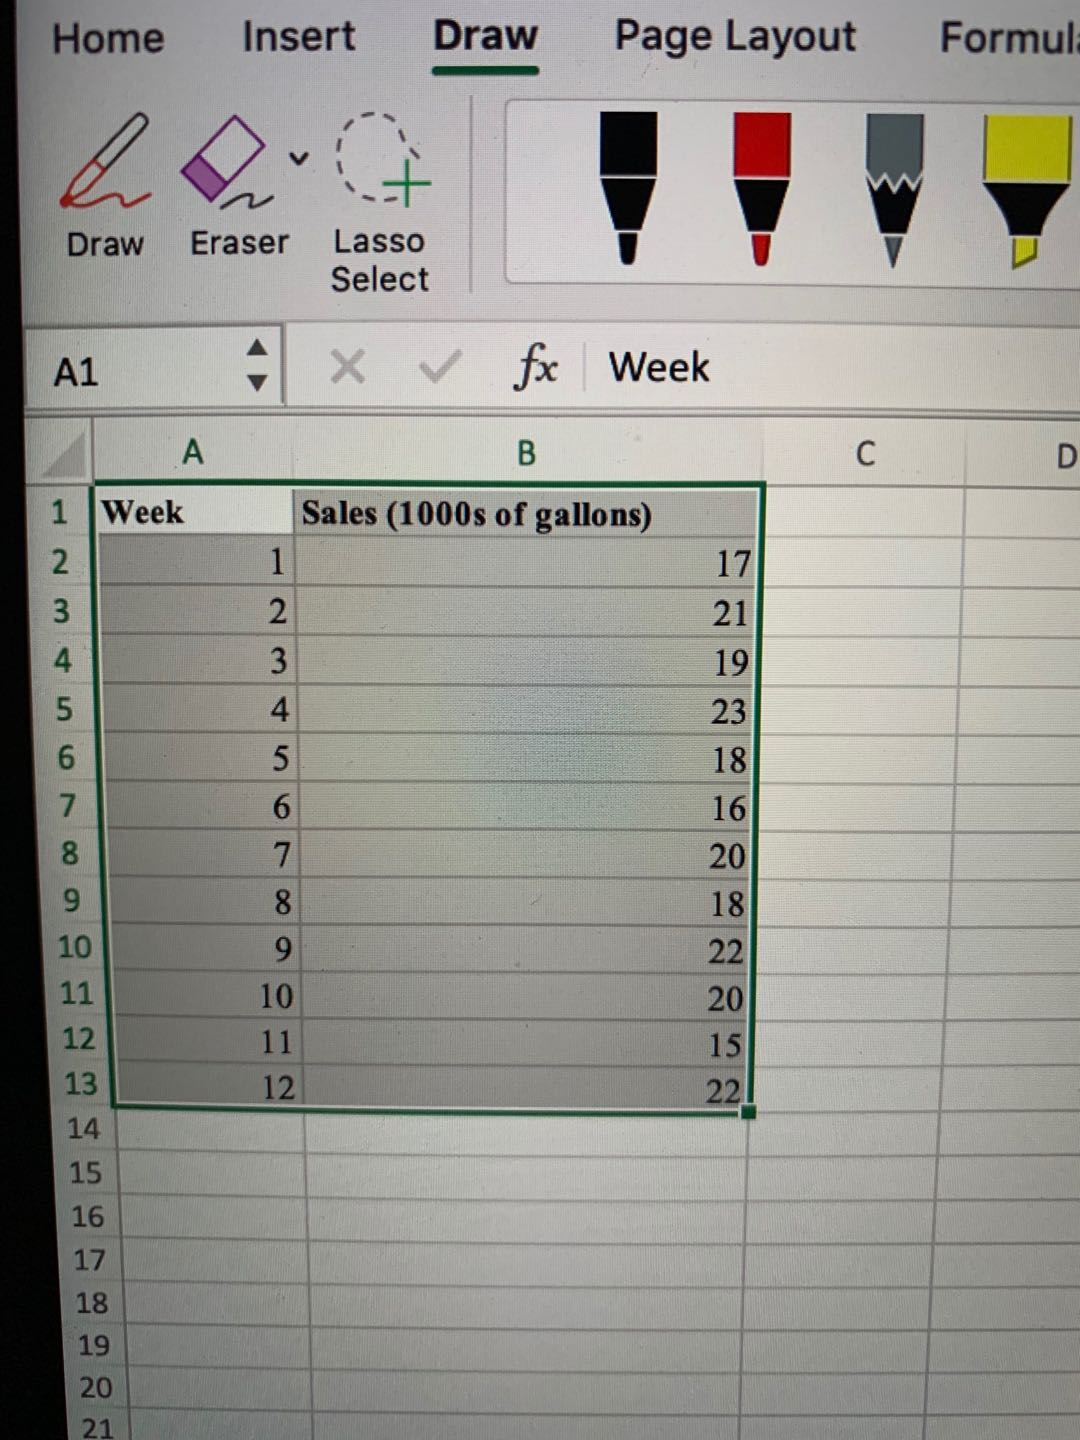
9. With a smoothing constant of a = 0.2, equation (8.7) shows that the forecast for week 13 of the gasoline sales data from Table 8.1 is given by y13 = 0.212 + 0.8y12. However, the forecast for week 12 is given by y12 - 0.2yn + 0.8yn1. Thus, we could combine these two results to show that the forecast for week 13 can be written as V13 = 0.2 y12 + 0.8(0.21 + 0.8y1) # 0.2y12 + 0.16y1 1 + 0.64yl a. Making use of the fact that yn1 = 0.2yo + 0.8 y10 (and similarly for y10 and y,), continue to expand the expression for y13 until it is written in terms of the past data values y12, ylI, y10, yo, y8, and the forecast for period 8, y's. b. Refer to the coefficients or weights for the past values y12, yII, yo, yo, and y. What observation can you make about how exponential smoothing weights past data val- ues in arriving at new forecasts? Compare this weighting pattern with the weighting pattern of the moving averages method.\f
Step by Step Solution
There are 3 Steps involved in it

Get step-by-step solutions from verified subject matter experts