Question: Please show the excel formulas as well!! A B E F G H 1 Mountain Ski Sports 2 Set up the newsvendor model below set
Please show the excel formulas as well!!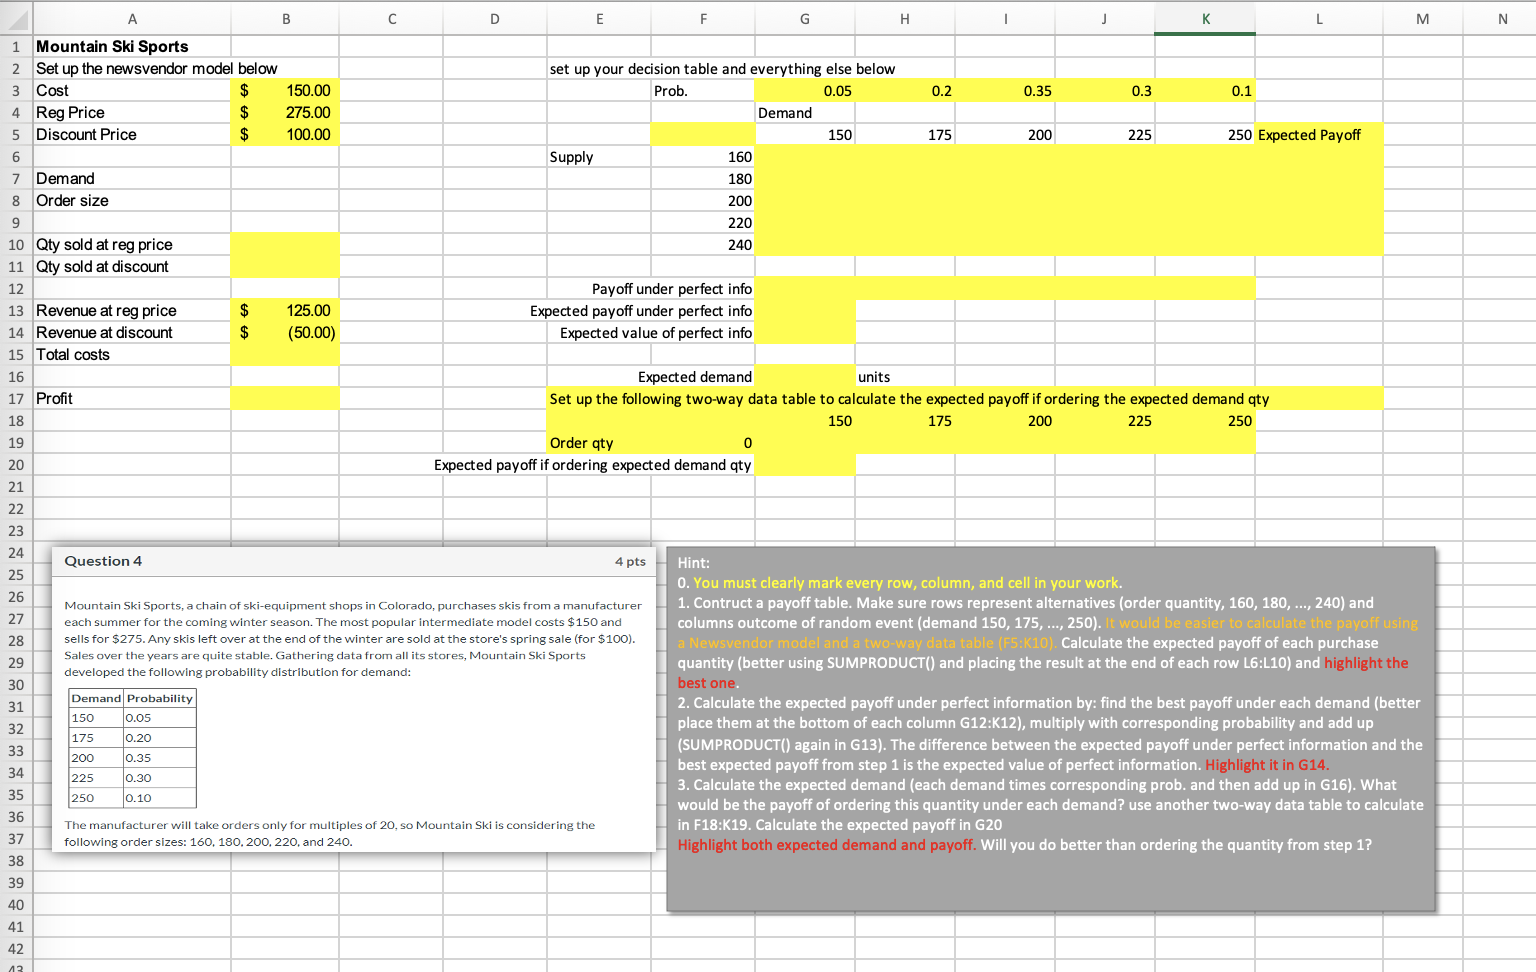
A B E F G H 1 Mountain Ski Sports 2 Set up the newsvendor model below set up your decision table and everything else below 3 Cost $ 150.00 Prob. 0.05 0.35 0.3 4 Reg Price $ 275.00 Demand 5 Discount Price $ 100.00 200 225 6 Supply 160 180 7 Demand 8 Order size 200 9 220 10 Qty sold at reg price 240 11 Qty sold at discount 12 Payoff under perfect info Expected payoff under perfect info 13 Revenue at reg price $ $ 125.00 (50.00) 14 Revenue at discount Expected value of perfect info 15 Total costs 16 Expected demand units 17 Profit Set up the following two-way data table to calculate the expected payoff if ordering the expected demand qty 150 175 18 200 225 250 19 Order qty 0 20 Expected payoff if ordering expected demand qty 21 22 23 24 Question 4 4 pts Hint: 25 O. You must clearly mark every row, column, and cell in your work. 26 27 28 Mountain Ski Sports, a chain of ski-equipment shops in Colorado, purchases skis from a manufacturer each summer for the coming winter season. The most popular intermediate model costs $150 and sells for $275. Any skis left over at the end of the winter are sold at the store's spring sale (for $100). Sales over the years are quite stable. Gathering data from all its stores, Mountain Ski Sports developed the following probability distribution for demand: 1. Contruct a payoff table. Make sure rows represent alternatives (order quantity, 160, 180, ..., 240) and columns outcome of random event (demand 150, 175, ..., 250). It would be easier to calculate the payoff using a Newsvendor model and a two-way data table (F5:K10). Calculate the expected payoff of each purchase quantity (better using SUMPRODUCT() and placing the result at the end of each row L6:L10) and highlight the best one. 29 30 Demand Probability 31 150 0.05 32 2. Calculate the expected payoff under perfect information by: find the best payoff under each demand (better place them at the bottom of each column G12:K12), multiply with corresponding probability and add up (SUMPRODUCT() again in G13). The difference between the expected payoff under perfect information and the best expected payoff from step 1 is the expected value of perfect information. Highlight it in G14. 175 0.20 33 200 0.35 34 225 0.30 35 250 0.10 3. Calculate the expected demand (each demand times corresponding prob. and then add up in G16). What would be the payoff of ordering this quantity under each demand? use another two-way data table to calculate in F18:K19. Calculate the expected payoff in G20 36 37 The manufacturer will take orders only for multiples of 20, so Mountain Ski is considering the following order sizes: 160, 180, 200, 220, and 240. Highlight both expected demand and payoff. Will you do better than ordering the quantity from step 1? 38 39 40 41 42 43 D 150 0.2 175 I K L 0.1 250 Expected Payoff M N


