

Question: Please show the excel formulas so it helps me know where numbers came from. Perform scenario analysis as follows: Scenario Probability Cost Savings WACC Salvage
Please show the excel formulas so it helps me know where numbers came from.
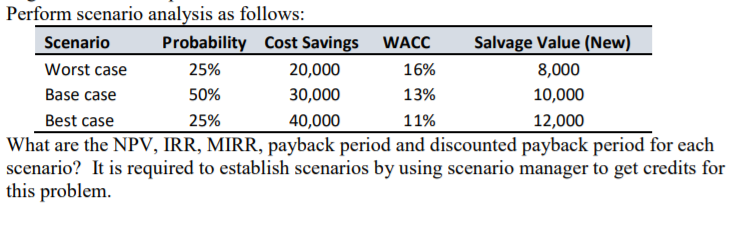
Perform scenario analysis as follows: Scenario Probability Cost Savings WACC Salvage Value (New) Worst case 25% 20,000 16% 8,000 Base case 50% 30,000 13% 10,000 Best case 25% 40,000 11% 12,000 What are the NPV, IRR, MIRR, payback period and discounted payback period for each scenario? It is required to establish scenarios by using scenario manager to get credits for this problem. Perform scenario analysis as follows: Scenario Probability Cost Savings WACC Salvage Value (New) Worst case 25% 20,000 16% 8,000 Base case 50% 30,000 13% 10,000 Best case 25% 40,000 11% 12,000 What are the NPV, IRR, MIRR, payback period and discounted payback period for each scenario? It is required to establish scenarios by using scenario manager to get credits for this
Step by Step Solution
There are 3 Steps involved in it

Get step-by-step solutions from verified subject matter experts