

Question: Please show the formula and answer for the highlighted in yellow. Thank You A begin{tabular}{l|l} C & D end{tabular} E F G K L M
Please show the formula and answer for the highlighted in yellow. Thank You
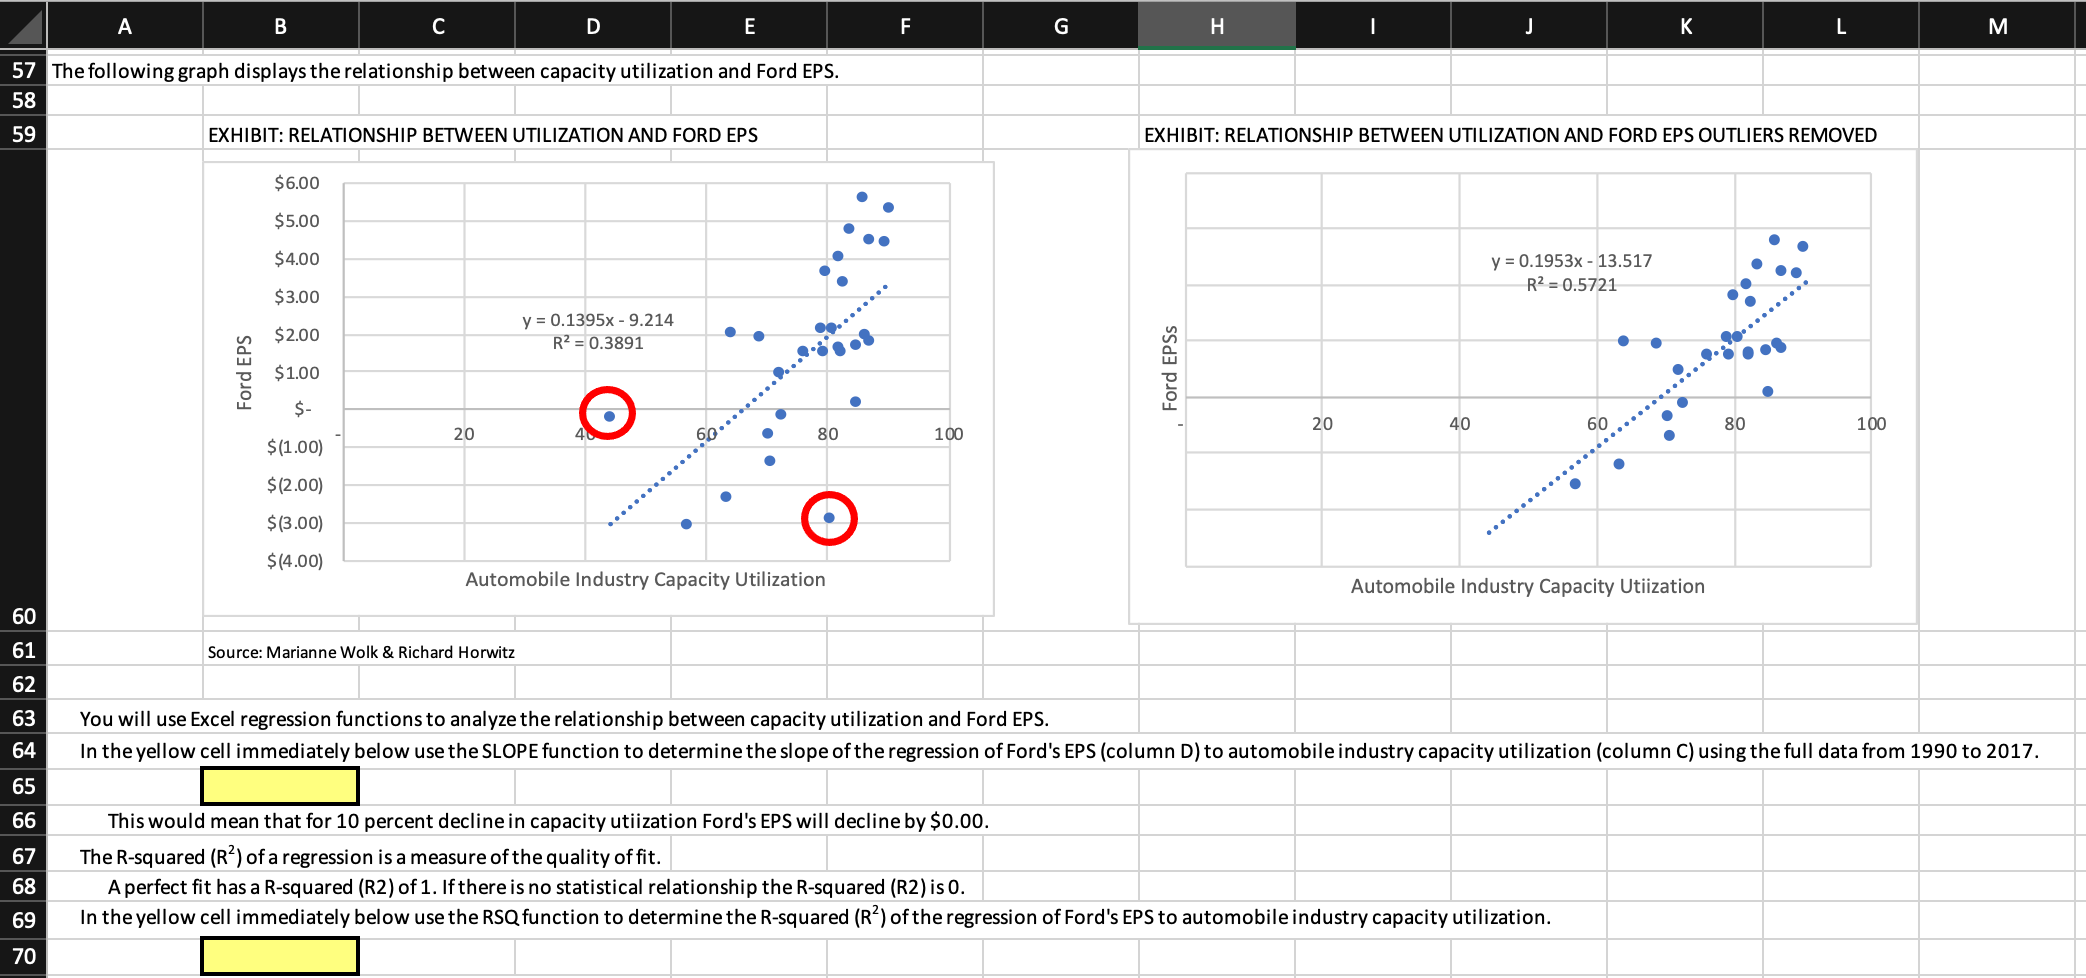
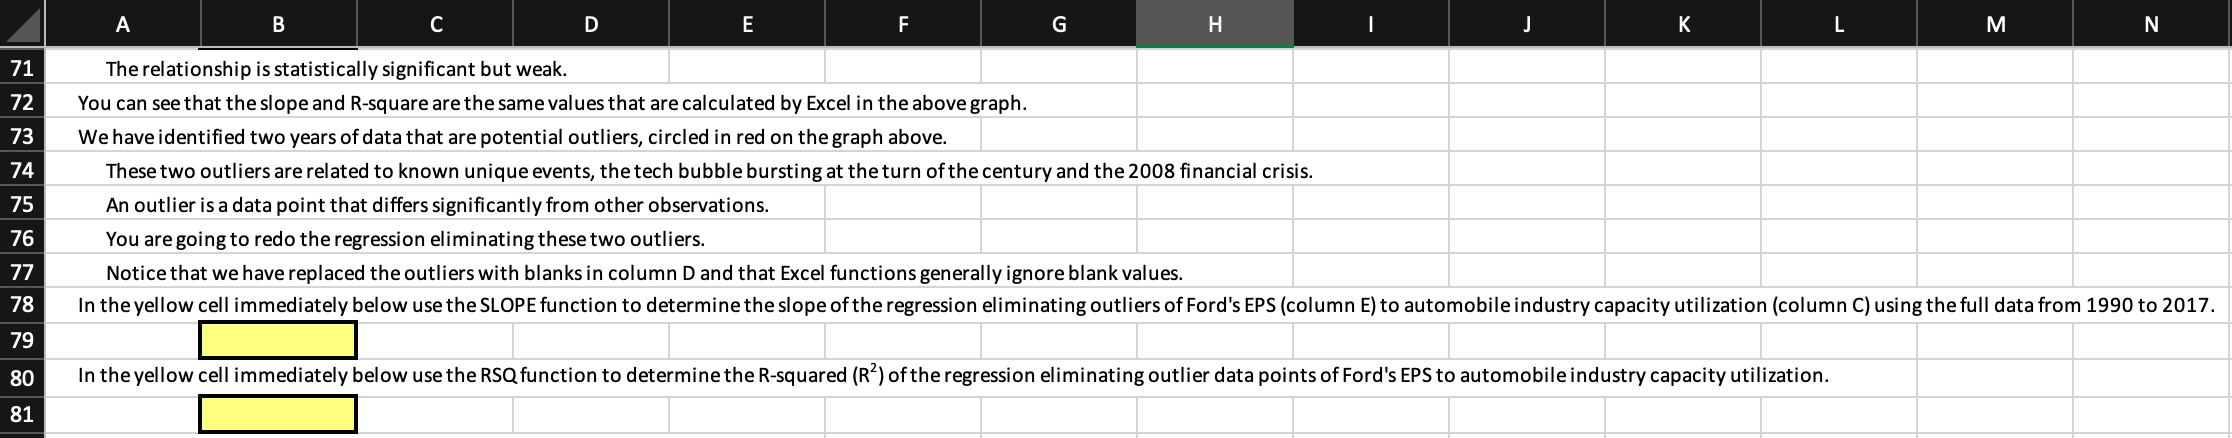
A \begin{tabular}{l|l} C & D \end{tabular} E F G K L M N The relationship is statistically significant but weak. You can see that the slope and R-square are the same values that are calculated by Excel in the above graph. We have identified two years of data that are potential outliers, circled in red on the graph above. These two outliers are related to known unique events, the tech bubble bursting at the turn of the century and the 2008 financial crisis. An outlier is a data point that differs significantly from other observations. You are going to redo the regression eliminating these two outliers. Notice that we have replaced the outliers with blanks in column D and that Excel functions generally ignore blank values. In the yellow cell immediately below use the RSQ function to determine the R-squared (R2) of the regression eliminating outlier data points of Ford's EPS to automobile industry capacity utilization. A \begin{tabular}{l|l} C & D \end{tabular} E F G K L M N The relationship is statistically significant but weak. You can see that the slope and R-square are the same values that are calculated by Excel in the above graph. We have identified two years of data that are potential outliers, circled in red on the graph above. These two outliers are related to known unique events, the tech bubble bursting at the turn of the century and the 2008 financial crisis. An outlier is a data point that differs significantly from other observations. You are going to redo the regression eliminating these two outliers. Notice that we have replaced the outliers with blanks in column D and that Excel functions generally ignore blank values. In the yellow cell immediately below use the RSQ function to determine the R-squared (R2) of the regression eliminating outlier data points of Ford's EPS to automobile industry capacity utilization
Step by Step Solution
There are 3 Steps involved in it

Get step-by-step solutions from verified subject matter experts