

Question: Please show the formulas needed for excel calculations. Problem 3 Fiscal Year Sales EBIT Total Net Income Dividends Paid per Share Basic EPS from Total
Please show the formulas needed for excel calculations.
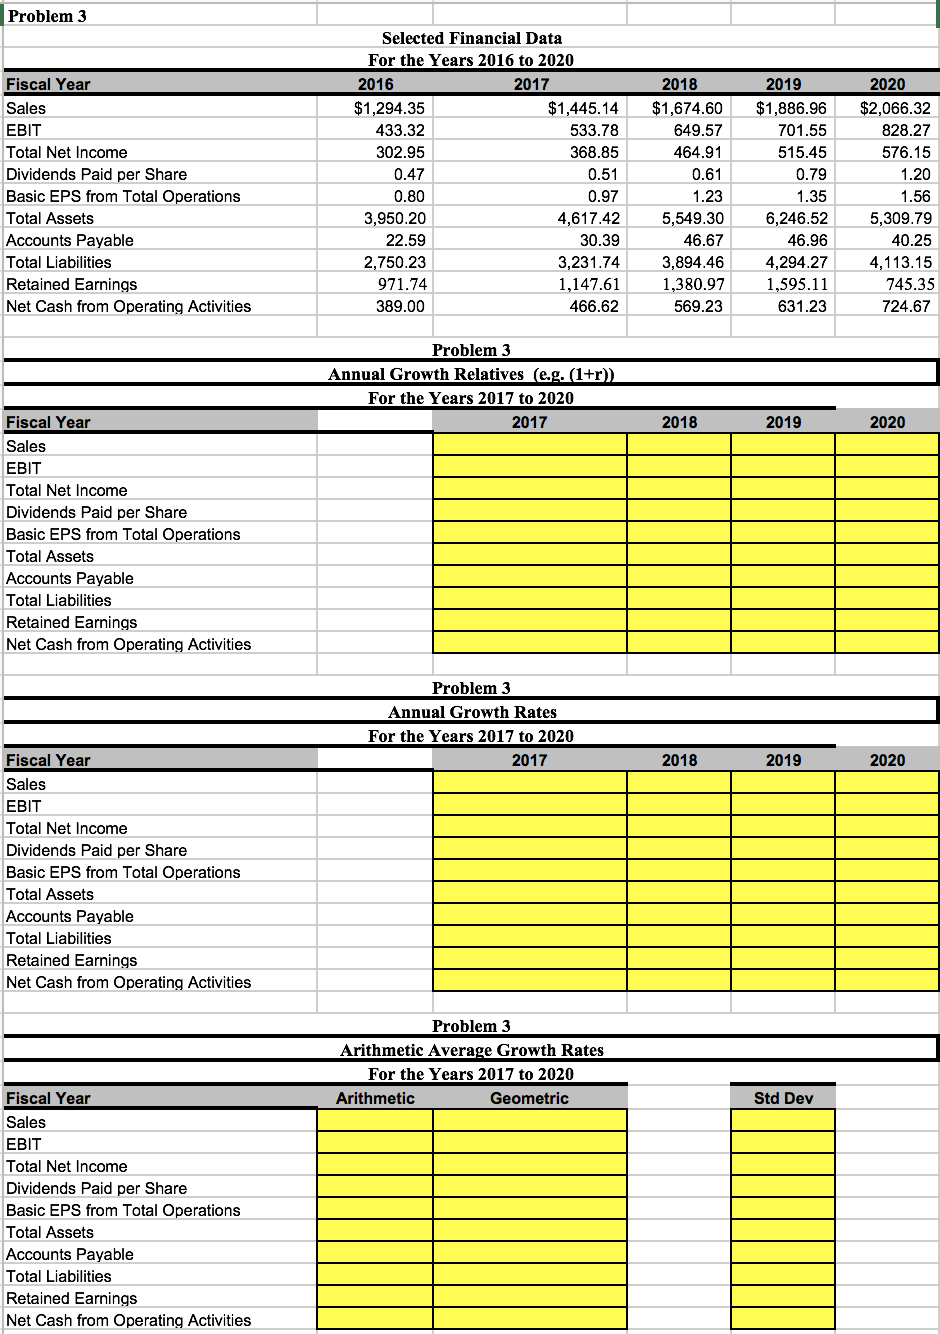
Problem 3 Fiscal Year Sales EBIT Total Net Income Dividends Paid per Share Basic EPS from Total Operations Total Assets Accounts Payable Total Liabilities Retained Earnings Net Cash from Operating Activities Selected Financial Data For the Years 2016 to 2020 2016 2017 $1,294.35 $1,445.14 433.32 533.78 302.95 368.85 0.47 0.51 0.80 0.97 3,950.20 4,617.42 22.59 30.39 2,750.23 3,231.74 971.74 1,147.61 389.00 466.62 2018 $1,674.60 649.57 464.91 0.61 1.23 5,549.30 46.67 3,894.46 1,380.97 569.23 2019 $1,886.96 701.55 515.45 0.79 1.35 6,246.52 46.96 4,294.27 1,595.11 631.23 2020 $2,066.32 828.27 576.15 1.20 1.56 5,309.79 40.25 4,113.15 745.35 724.67 Problem 3 Annual Growth Relatives (e.g. (1+r)) For the Years 2017 to 2020 2017 2018 2019 2020 Fiscal Year Sales EBIT Total Net Income Dividends Paid per Share Basic EPS from Total Operations Total Assets Accounts Payable Total Liabilities Retained Earnings Net Cash from Operating Activities Problem 3 Annual Growth Rates For the Years 2017 to 2020 2017 Fiscal Year 2018 2019 2020 Sales EBIT Total Net Income Dividends Paid per Share Basic EPS from Total Operations Total Assets Accounts Payable Total Liabilities Retained Earnings Net Cash from Operating Activities Problem 3 Arithmetic Average Growth Rates For the Years 2017 to 2020 Arithmetic Geometric Std Dev Fiscal Year Sales EBIT Total Net Income Dividends Paid per Share Basic EPS from Total Operations Total Assets Accounts Payable Total Liabilities Retained Earnings Net Cash from Operating Activities
Step by Step Solution
There are 3 Steps involved in it

Get step-by-step solutions from verified subject matter experts