

Question: please show the process in excel The information contained in the table below shows the expected return and standard deviation for the market and Treasury
please show the process in excel
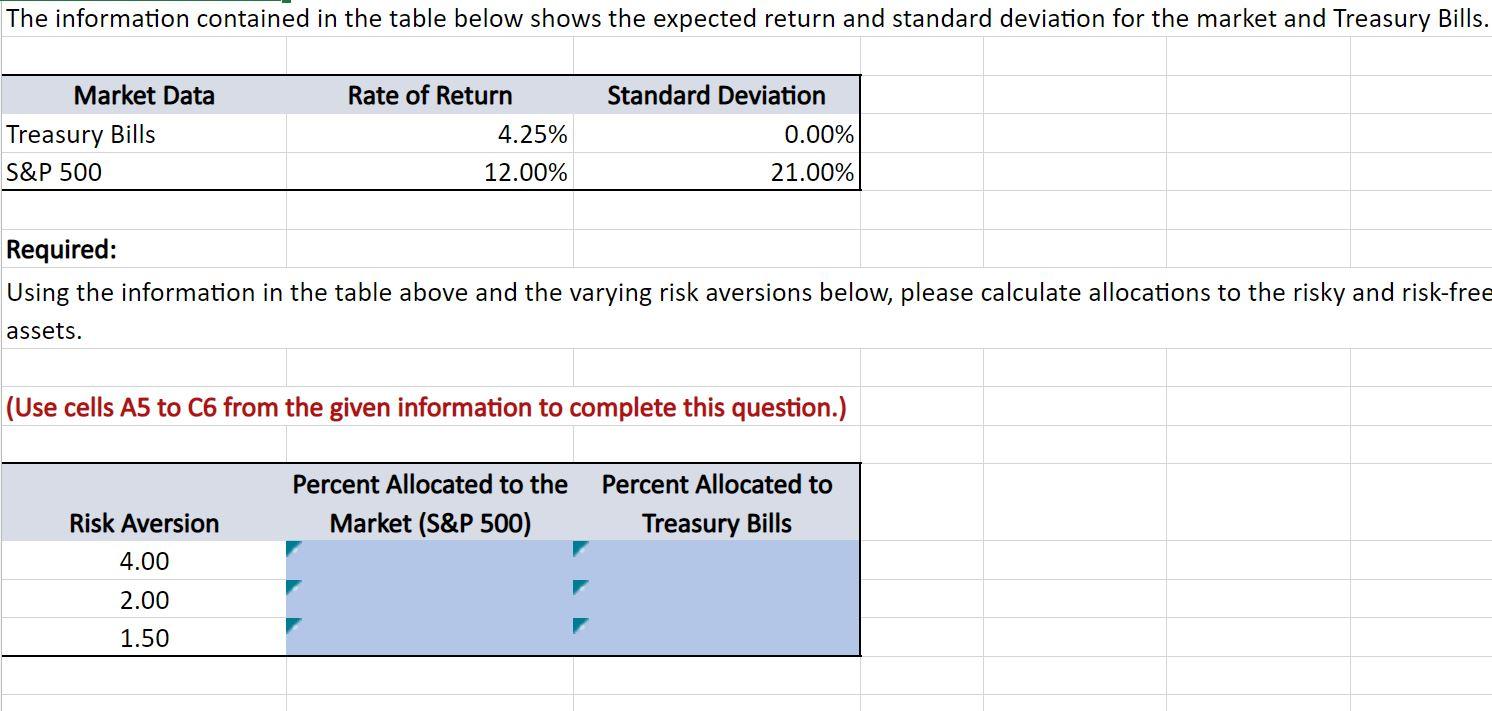
The information contained in the table below shows the expected return and standard deviation for the market and Treasury Bills. Market Data Treasury Bills S&P 500 Rate of Return 4.25% Standard Deviation 0.00% 21.00% 12.00% Required: Using the information in the table above and the varying risk aversions below, please calculate allocations to the risky and risk-free assets. (Use cells A5 to C6 from the given information to complete this question.) Percent Allocated to the Market (S&P 500) Percent Allocated to Treasury Bills Risk Aversion 4.00 2.00 1.50
Step by Step Solution
There are 3 Steps involved in it
1 Expert Approved Answer
Step: 1 Unlock

Question Has Been Solved by an Expert!
Get step-by-step solutions from verified subject matter experts
Step: 2 Unlock
Step: 3 Unlock