

Question: Please show the questions step by step through the lingo program PRODUCTION MIX with LINGO a) Formulate a complete linear programming model in algebraic form
Please show the questions step by step through the lingo program
PRODUCTION MIX with LINGO
a) Formulate a complete linear programming model in algebraic form that shows the individual constraints and decision variables for this problem. b) Using the model obtained in part a and details given in the case study, please fix the highlighted parts of the following LINGO program so that is produces optimum objective function value of $333680.
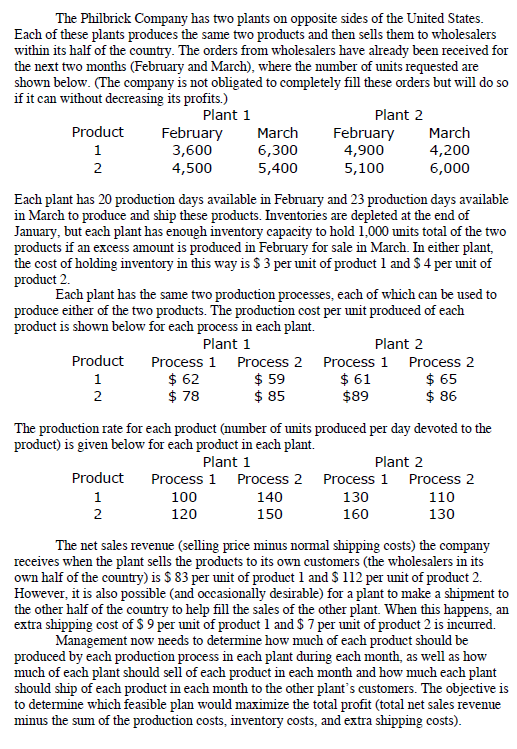
The Philbrick Company has two plants on opposite sides of the United States Each of these plants produces the same two products and then sells them to wholesalers within its half of the country. The orders from wholesalers have already been received for the next two months (February and March), where the number of units requested are shown below. (The company is not obligated to completely fill these orders but will do so if it can without decreasing its profits.) Plant 1 Plant 2 Product February 3,600 4,500 March February 6,300 5,400 4,900 5,100 March 4,200 6,000 Each plant has 20 production days available in February and 23 production days available in March to produce and ship these products. Inventories are depleted at the end of January, but each plant has enough inventory capacity to hold 1,000 units total of the two products if an excess amount is produced in February for sale in March In either plant, the cost of holding inventory in this way is S 3 per unit of product 1 and S 4 per unit of product 2. act2 n o Pt % Each plant has the same two production processes, each of which can be used to produce either of the two products. The production cost per unit produced of each t is shown below for each process in each plant. Plant 1 Plant 2 Product Process 1 $ 62 $ 78 Process 2 $ 59 $ 85 Process 1 $ 61 $89 Process 2 $ 65 $ 86 The production rate for each product (number of units produced per day devoted to the product) is given below for each product in each plant. Plant 2 Product Process 1 Process 2 Process 1 Process 2 140 150 100 120 130 160 110 130 2 The net sales revenue (selling price minus normal shipping costs) the company receives when the plant sells the products to its own customers (the wholesalers in its own half of the country) is $ 83 per unit of product 1 and S 112 per unit of product 2. However, it is also possible (and occasionally desirable) for a plant to make a shipment to the other half of the country to help fill the sales of the other plant. When this happens, an extra shipping cost of S 9 per unit of product 1 and $ 7 per unit of product 2 is incured. Management now needs to detemine how much of each product should be produced by each production process in each plant during each month, as well as how much of each plant should sell of each product in each month and how much each plant should ship of each product in each month to the other plant's customers. The objective is to determine which feasible plan would maximize the total profit (total net sales revenue minus the sum of the production costs, inventory costs, and extra shipping costs) The Philbrick Company has two plants on opposite sides of the United States Each of these plants produces the same two products and then sells them to wholesalers within its half of the country. The orders from wholesalers have already been received for the next two months (February and March), where the number of units requested are shown below. (The company is not obligated to completely fill these orders but will do so if it can without decreasing its profits.) Plant 1 Plant 2 Product February 3,600 4,500 March February 6,300 5,400 4,900 5,100 March 4,200 6,000 Each plant has 20 production days available in February and 23 production days available in March to produce and ship these products. Inventories are depleted at the end of January, but each plant has enough inventory capacity to hold 1,000 units total of the two products if an excess amount is produced in February for sale in March In either plant, the cost of holding inventory in this way is S 3 per unit of product 1 and S 4 per unit of product 2. act2 n o Pt % Each plant has the same two production processes, each of which can be used to produce either of the two products. The production cost per unit produced of each t is shown below for each process in each plant. Plant 1 Plant 2 Product Process 1 $ 62 $ 78 Process 2 $ 59 $ 85 Process 1 $ 61 $89 Process 2 $ 65 $ 86 The production rate for each product (number of units produced per day devoted to the product) is given below for each product in each plant. Plant 2 Product Process 1 Process 2 Process 1 Process 2 140 150 100 120 130 160 110 130 2 The net sales revenue (selling price minus normal shipping costs) the company receives when the plant sells the products to its own customers (the wholesalers in its own half of the country) is $ 83 per unit of product 1 and S 112 per unit of product 2. However, it is also possible (and occasionally desirable) for a plant to make a shipment to the other half of the country to help fill the sales of the other plant. When this happens, an extra shipping cost of S 9 per unit of product 1 and $ 7 per unit of product 2 is incured. Management now needs to detemine how much of each product should be produced by each production process in each plant during each month, as well as how much of each plant should sell of each product in each month and how much each plant should ship of each product in each month to the other plant's customers. The objective is to determine which feasible plan would maximize the total profit (total net sales revenue minus the sum of the production costs, inventory costs, and extra shipping costs)
Step by Step Solution
There are 3 Steps involved in it

Get step-by-step solutions from verified subject matter experts