

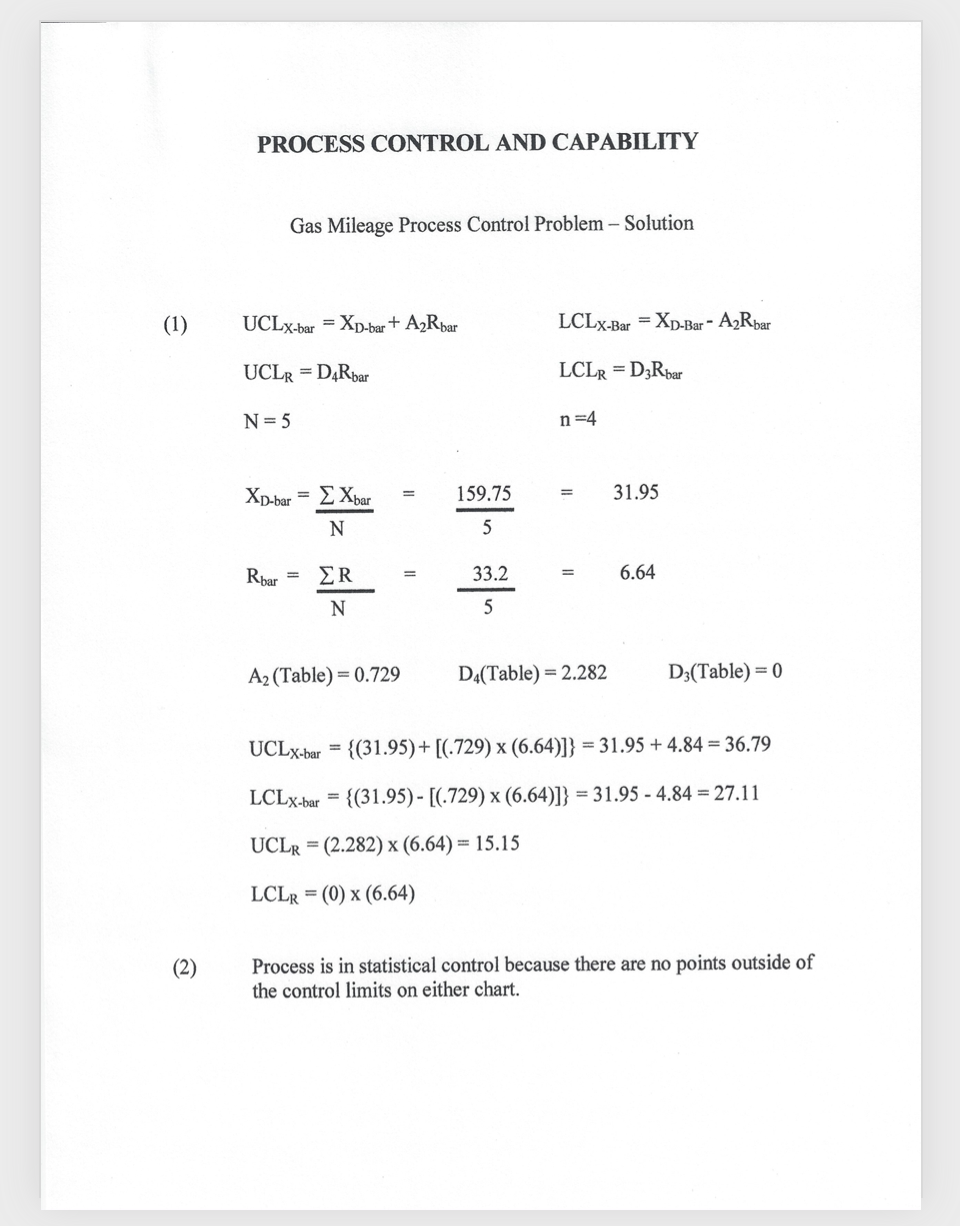
Question: Please show the steps you used to get to answer, added solution so you can check your work, will rate any answer. Need to know
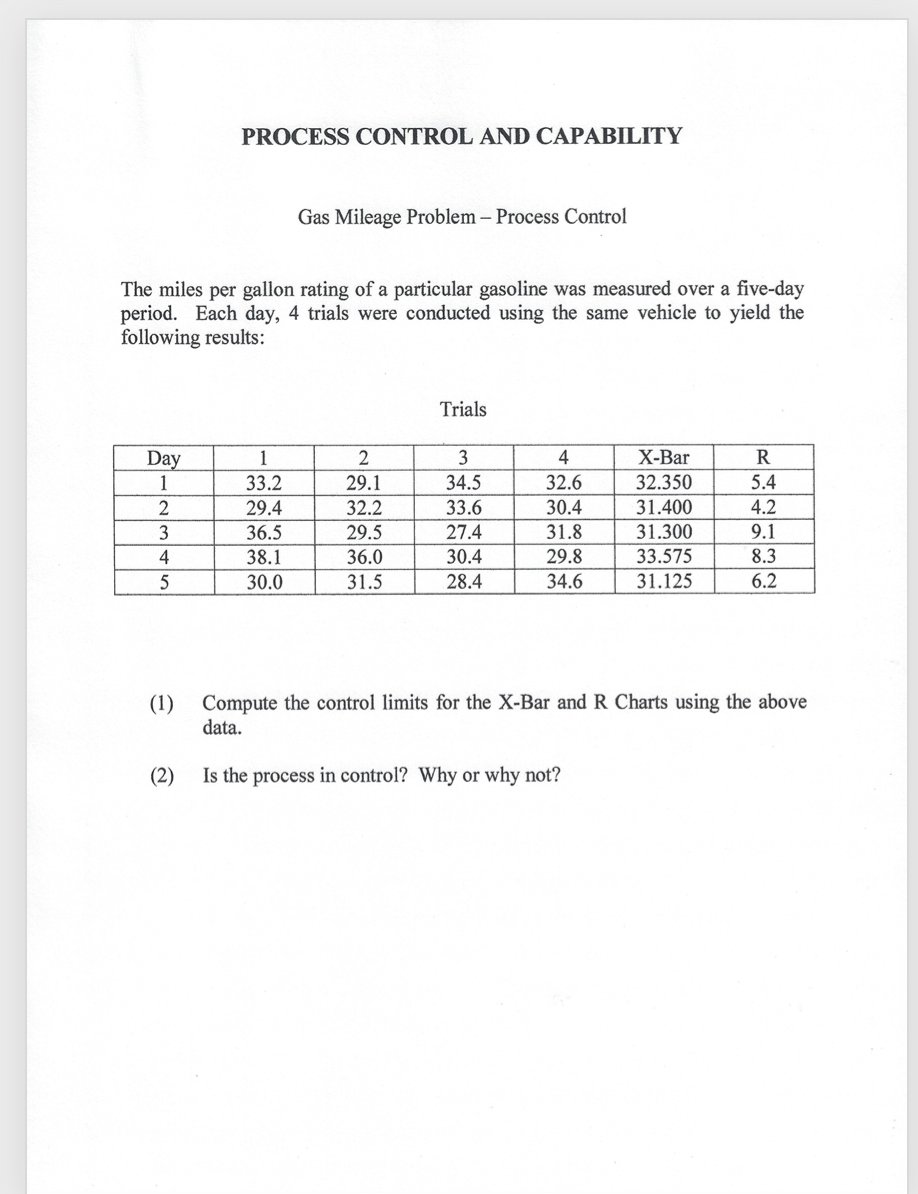
Please show the steps you used to get to answer, added solution so you can check your work, will rate any answer. Need to know how to get A2, D4, D3.
Step by Step Solution
There are 3 Steps involved in it
1 Expert Approved Answer
Step: 1 Unlock

Question Has Been Solved by an Expert!
Get step-by-step solutions from verified subject matter experts
Step: 2 Unlock
Step: 3 Unlock