

Question: Please show the work on Excel spread sheet. Thank you! Calculate the followings and verify the diversification effect with the data in the table assuming
Please show the work on Excel spread sheet. Thank you!
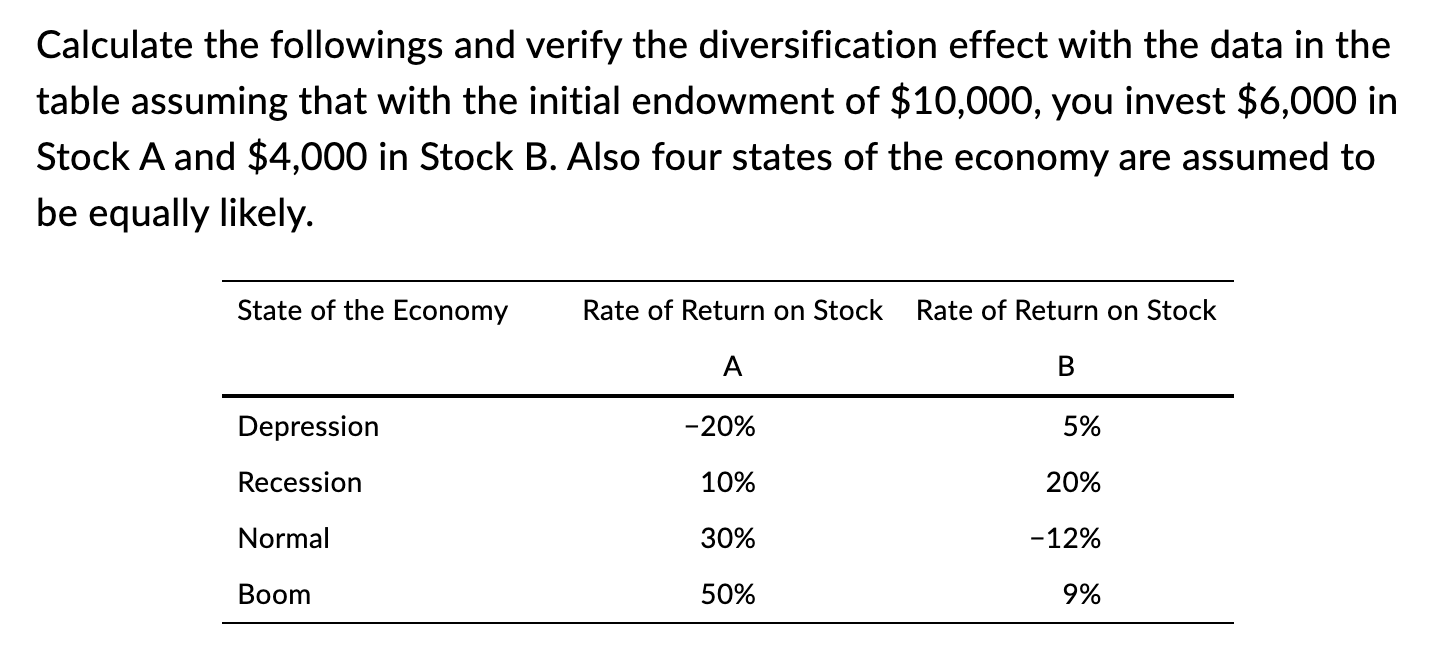
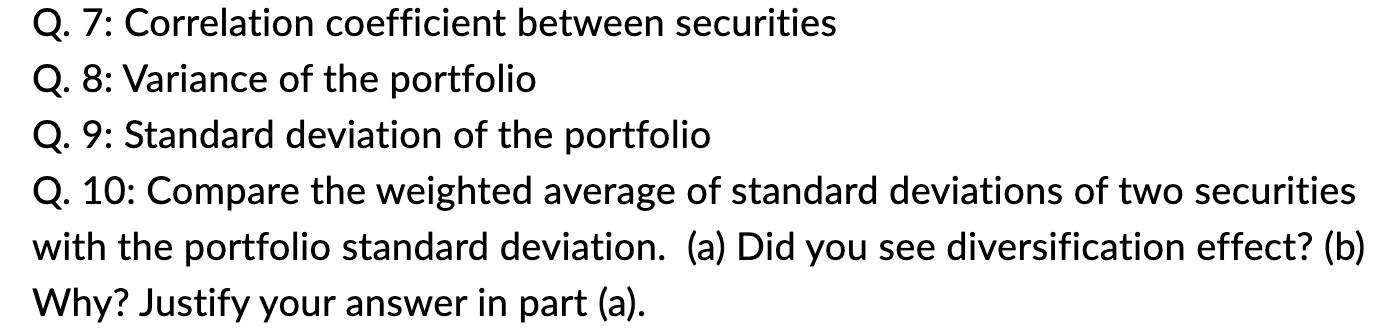
Calculate the followings and verify the diversification effect with the data in the table assuming that with the initial endowment of $10,000, you invest $6,000 in Stock A and $4,000 in Stock B. Also four states of the economy are assumed to be equally likely. State of the Economy Rate of Return on Stock Rate of Return on Stock A B Depression -20% 5% Recession 10% 20% Normal 30% -12% Boom 50% 9% Q. 7: Correlation coefficient between securities Q. 8: Variance of the portfolio Q. 9: Standard deviation of the portfolio Q. 10: Compare the weighted average of standard deviations of two securities with the portfolio standard deviation. (a) Did you see diversification effect? (b) Why? Justify your answer in part (a)
Step by Step Solution
There are 3 Steps involved in it

Get step-by-step solutions from verified subject matter experts