

Question: Please show work 1. Static and Flexible Budgets a. In the Excel template, sheet Ex1 Operating, compute the variance between plan and actual results in
Please show work
1. Static and Flexible Budgets
a. In the Excel template, sheet Ex1 Operating, compute the variance between plan and actual results in column H. Analyze each variance to determine if it is favorable (F) or unfavorable (U) and input U or F in column I.
b. Using your own interpretation of the PPT slides and other materials you have studied for this lesson, explain the difference between a static budget and a flexible budget, and under what circumstances each would be most useful.
c. In the Excel template, sheet Ex1 Operating, prepare a flexible budget for the past year in column K, flexing solely on total actual units sold. In column M, compute the variance between the flex plan vs. actual results and indicate in column N whether each variance is favorable (F) or unfavorable (U).
d. Compare the favorable/unfavorable indicators for the static budget variances vs. the flexible budget variances. Identify the differences and explain what factors you think contribute to these differences.
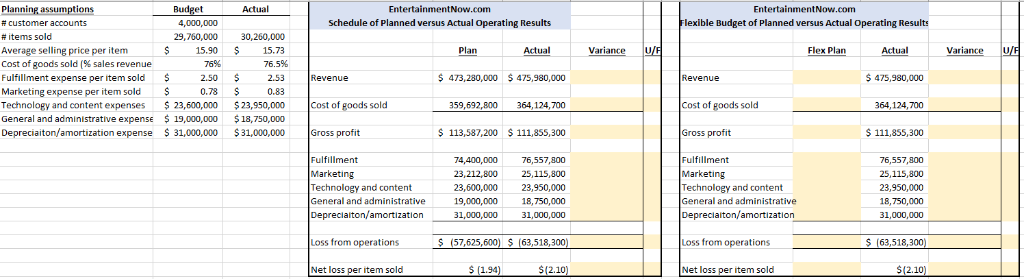
Planning assumptions Budget Actual EntertainmentNow.com EntertainmentNow.com Flexible Budget of Planned versus Actual Operating Results Schedule of Planned versus Actual Operating Results accounts rrold 29.760.000 30,260,000 U/F Average selling price per item 15.90 15.73 Plan Actual Variance Flex Plan Actual Variance 76.5 % 76 % Cost of goods sold (% sales revenue Fulfillment expense per item sold Marketing expense per item sold Technology and content expenses S 473,280,000 $475,980,000 2.50 2.53 Revenue Revenue 475,980,000 S 0.78 0.83 $ 23,950,000 Cost of goods sold $ 23,600,000 Cost of goods sold 359.692.800 364,124,700 364,124,700 expense tization expense Gross profit Gross profit 113,587,200 $111,855,3000 31 000 000 111,855,300 Fulfillment Marketing Technology and content General and administrative Fulfillment Marketing 74,400,000 76,557,800 76,557,800 23,212,800 25,115,800 25,115,800 Technology and content General and administrative 23.600.000 23.950,000 23,950,000 19.000,000 18.750.000 8,750,000 Depreciaiton/amortization Depreciaiton/amortization 31,000,000 31,000,000 31,000,000 Loss from operations s (57.625.600) S (63.518.300) Loss from operations (63.518.300) Net loss per item sold $(2.10) Net loss per item sold $(2.10) (1.94)
Step by Step Solution
There are 3 Steps involved in it

Get step-by-step solutions from verified subject matter experts