

Question: PLEASE SHOW WORK! 12-24. Excel Application: Creating a Gantt Chart with Excel In 1920, Henry Gantt, a U.S. engineer, developed the scheduling and monitoring diagram
PLEASE SHOW WORK!
12-24. Excel Application: Creating a Gantt Chart with Excel In 1920, Henry Gantt, a U.S. engineer, developed the scheduling and monitoring diagram that bears his name. At the time it was an innovation. Today, the Gantt chart is a standard management tool used by project managers around the world to chart the progress of their projects. Project managers likely use specialized software such as Microsoft Project to create Gantt charts. Another option is to use Excel.
You can create a Gantt chart with Excel by customizing a stacked bar chart. Enter the data from Figure 12-23 into Excel.
Select the headers and data for Tasks, Start Date, and Duration (Days) and create Stacked Bar Chart.
Right-click on the chart and click Select Data.
In Legend Entries (Series), remove Duration (Days).
Click on Add to add a new series with Series Name Start Date and Series values B4:B11.
Click on Add again to add another new series, with Series Name Duration (Days) and Series values C4:C11.
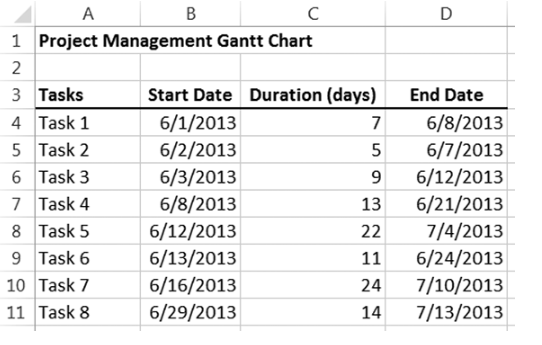
Figure 12-23 Data for Gantt chart.
Source: Microsoft Excel, Microsoft Corporation. Reprinted with permission.
Figure 12-23 Full Alternative Text
Click on the y-axis, select Format Axis, and check the box Categories in reverse order to put the rows in order.
Right-click on the first part of the first stacked bar and choose Format Data Series. Choose Fill, then click No Fill to make those parts of the stacked bar invisible.
To start the chart at the projects start date, you need to correct that axis. Excel converts June 1, 2013, to 41426, which you can see for yourself if you change the format of the cell to numeric rather than date. Now click on the x-axis at the top of the chart, and select Format Axis. Change the Minimum to Fixed, and then enter 41426.
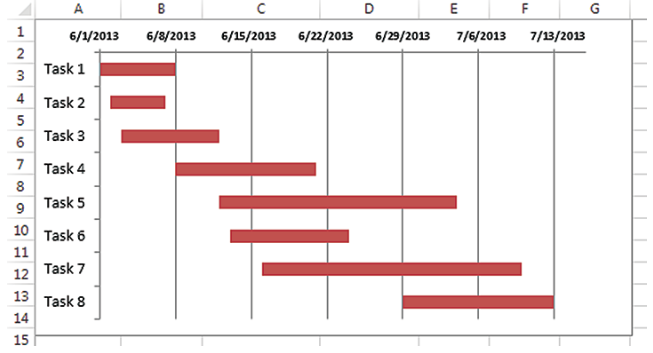
Finally, delete the legend at the right. Your Gantt chart should look similar to the one in Figure 12-24.
If you need more help, you can find videos that walk you through the process on YouTub by using the search terms Excel Gantt Chart.
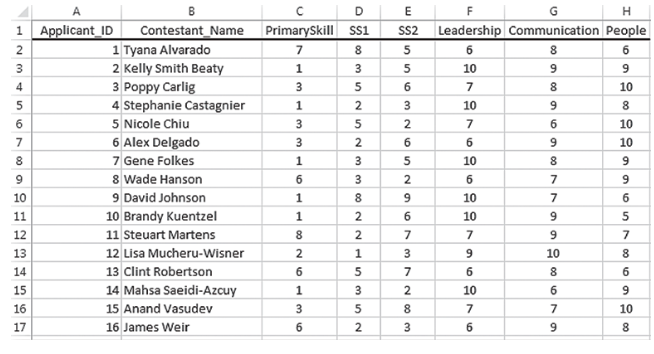
Your manager asked you to create a database to track the project management skills of a recent group of candidates applying for the project manager position at your company. Create a database that includes two tables: the Applicant table to store applicant data and the Skills table to store the characteristics of effective project managers listed in Figure 12-8 . Use the Lookup Wizard to look up values from the Skills table and insert them into the Applicants table to identify each applicants primary skill (PrimarySkill), secondary skill 1 (SS1), and secondary skill 2 (SS2).
Record the relevant data for the 16 applicants listed in Figure 12-25 that includes rating scores on three skills: leadership, communication, and people. Write a query that identifies the contestant(s) whose primary skill is leadership. Modify the query to identify the applicant(s) whose primary skill is leadership and SS1 is communication. Modify the query to identify the applicants whose critical thinking skills are rated primary, SS1, or SS2.
Create a calculated field in the query to calculate a weighted Score for each applicant wherein leadership is weighted highest, communication is weighted second highest, and people is weighted third highest. Use the following formula to calculate score. When you type the expression in the Field row, be sure to put the field names inside brackets.
Score = ([Leadership]*3) + ([Communication]*2) + ([People]*1)]
Based on this weighted score, which candidate should the company hire to be the project manager?
\begin{tabular}{c|r|r|r|r|} \hline & \multicolumn{1}{c|}{ A } & \multicolumn{1}{c|}{ B } & \multicolumn{1}{c|}{C} \\ \hline 1 & \multicolumn{2}{|l|}{ Project Management Gantt Chart } & \\ \hline 2 & & & & \\ \hline 3 & Tasks & Start Date & Duration (days) & End Date \\ \hline 4 & Task 1 & 6/1/2013 & 7 & 6/8/2013 \\ \hline 5 & Task 2 & 6/2/2013 & 5 & 6/7/2013 \\ \hline 6 & Task 3 & 6/3/2013 & 9 & 6/12/2013 \\ \hline 7 & Task 4 & 6/8/2013 & 13 & 6/21/2013 \\ \hline 8 & Task 5 & 6/12/2013 & 22 & 7/4/2013 \\ \hline 9 & Task 6 & 6/13/2013 & 11 & 6/24/2013 \\ \hline 10 & Task 7 & 6/16/2013 & 24 & 7/10/2013 \\ \hline 11 & Task 8 & 6/29/2013 & 14 & 7/13/2013 \\ \hline \end{tabular}Step by Step Solution
There are 3 Steps involved in it

Get step-by-step solutions from verified subject matter experts