

Question: Please show work 2.19 Oasis is a pineapple soft drink sold in Germany. The monthly sales data over the past 44 months are reported in
Please show work
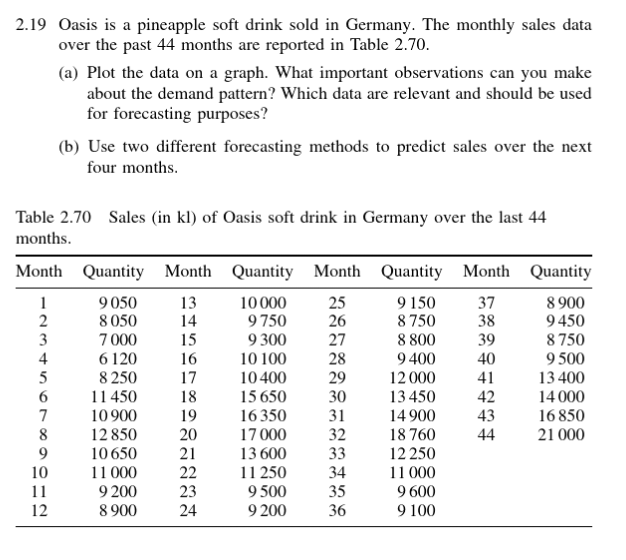
2.19 Oasis is a pineapple soft drink sold in Germany. The monthly sales data over the past 44 months are reported in Table 2.70. (a) Plot the data on a graph. What important observations can you make about the demand pattern? Which data are relevant and should be used for forecasting purposes? (b) Use two different forecasting methods to predict sales over the next four months. 13 25 37 Table 2.70 Sales (in kl) of Oasis soft drink in Germany over the last 44 months. Month Quantity Month Quantity Month Quantity Month Quantity 1 9050 10 000 9 150 8 900 2 8050 14 9 750 26 8750 38 9 450 3 7000 15 9 300 27 8 800 39 8 750 4 6120 10 100 9 400 9500 5 8 250 17 10400 12 000 13 400 6 11 450 18 15650 30 13450 42 14000 7 10900 19 16 350 31 14900 43 16 850 8 12 850 17 000 18 760 44 21 000 9 10650 21 13600 33 12 250 10 11 000 22 11 250 11 000 11 9 200 23 9 500 35 9600 12 8 900 24 9 200 36 9 100 16 28 29 40 41 20 32 34Step by Step Solution
There are 3 Steps involved in it
1 Expert Approved Answer
Step: 1 Unlock

Question Has Been Solved by an Expert!
Get step-by-step solutions from verified subject matter experts
Step: 2 Unlock
Step: 3 Unlock