

Question: PLEASE SHOW WORK 3. The following is information for three local auto dealers: Europe's Best Bell's Domestics $38,115 1,485 816,750 Junior's Used $29,403 1,832 1,089,000
PLEASE SHOW WORK
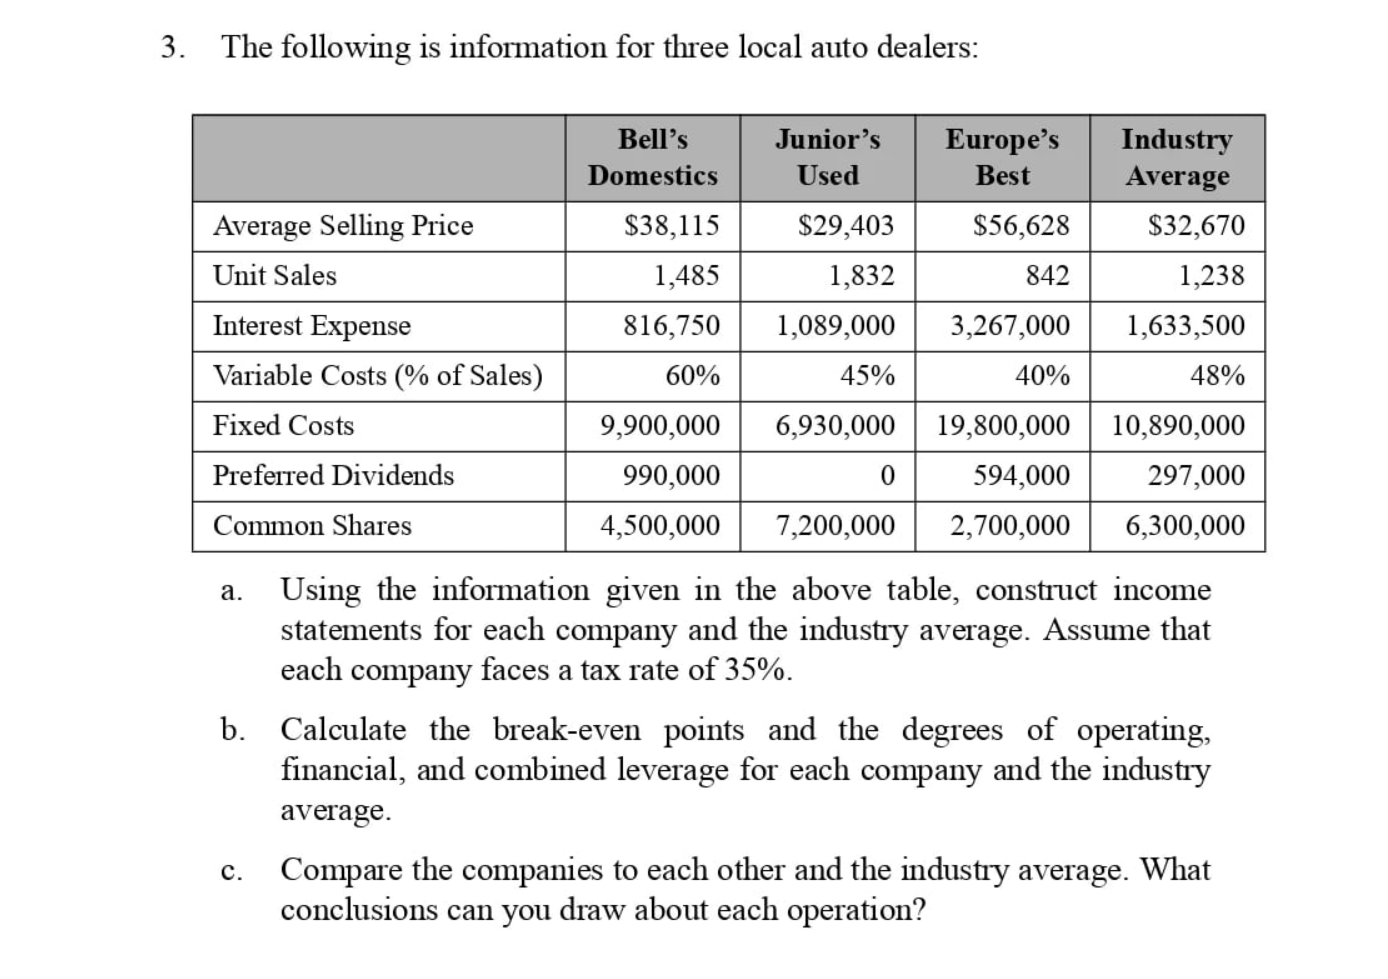
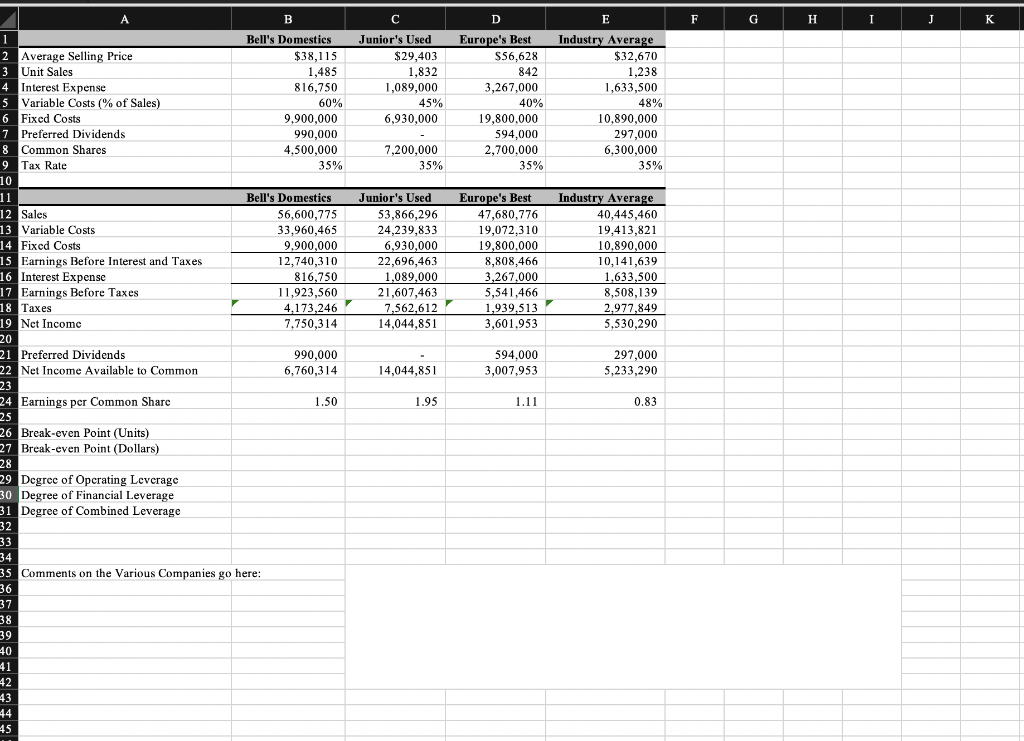
3. The following is information for three local auto dealers: Europe's Best Bell's Domestics $38,115 1,485 816,750 Junior's Used $29,403 1,832 1,089,000 Industry Average $32,670 $56,628 842 1,238 3,267,000 1,633,500 Average Selling Price Unit Sales Interest Expense Variable Costs (% of Sales) Fixed Costs Preferred Dividends Common Shares 60% 45% 40% 48% 9,900,000 990,000 4,500,000 6,930,000 19,800,000 594,000 7,200,000 2,700,000 10,890,000 297,000 6,300,000 a. Using the information given in the above table, construct income statements for each company and the industry average. Assume that each company faces a tax rate of 35%. b. Calculate the break-even points and the degrees of operating, financial, and combined leverage for each company and the industry average. Compare the companies to each other and the industry average. What conclusions can you draw about each operation? c. A B C D F H I J K Junior's Used $29,403 1,832 1,089,000 45% 6,930.000 Europe's Best $56,628 842 3,267,000 40% 19,800.000 594,000 2,700,000 35% E Industry Average $32,670 1,238 1,633,500 48% 10,890,000 297,000 6,300,000 35% 7,200,000 35% Junior's Used 53,866,296 24,239,833 6,930,000 22,696,463 1,089,000 21,607,463 7,562,612 14,044,851 Europe's Best 47,680,776 19,072,310 19,800,000 8,808,466 3,267.000 5,541,466 1,939,513 3,601,953 Industry Average 40,445,460 19,413,821 10.890,000 10.141,639 1,633,500 8,508,139 2,977.849 5,530.290 594.000 3,007,953 297,000 5,233,290 14.044,851 1 Bell's Domestics 2 Average Selling Price $38,115 3 Unit Sales 1,485 4 Interest Expense 816,750 5 Variable Costs (% of Sales) 60% 6 Fixed Costs 9,900,000 7 Preferred Dividends 990,000 8 Common Shares 4,500,000 9 Tax Rate 35% 10 10 11 Bell's Domestics 12 Sales 56,600,775 13 Variable Costs 33,960,465 14 Fixed Costs 9.900,000 15 Earnings Before Interest and Taxes 12,740,310 16 Interest Expense 816,750 17 Earnings Before Taxes 11,923,560 16 18 Taxes 4,173,246 19 Net Income 7.750,314 20 20 21 Preferred Dividends 990,000 22 Net Income Available to Common 6,760,314 23 24 Earnings per Common Share 1.50 25 26 Break-even Point (Units) 27 Break-even Point (Dollars) 28 29 Degree of Operating Leverage 30 Degree of Financial Leverage 31 Degree of Combined Leverage 32 22 33 24 34 a 35 Comments on the Various Companies go here: 36 37 38 38 39 40 +0 41 11 42 43 44 45 1.95 1.11 0.83 36
Step by Step Solution
There are 3 Steps involved in it

Get step-by-step solutions from verified subject matter experts