

Question: Please show work ( adding numbers or cells) , will rate. thank you . Calculate the cash conversion cycle for Cheap Goods Inc., given the
Please show work ( adding numbers or cells) , will rate. thank you .
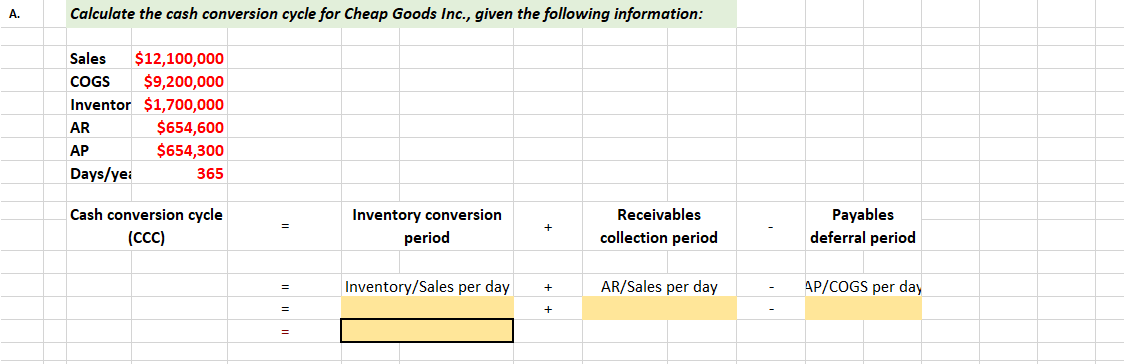
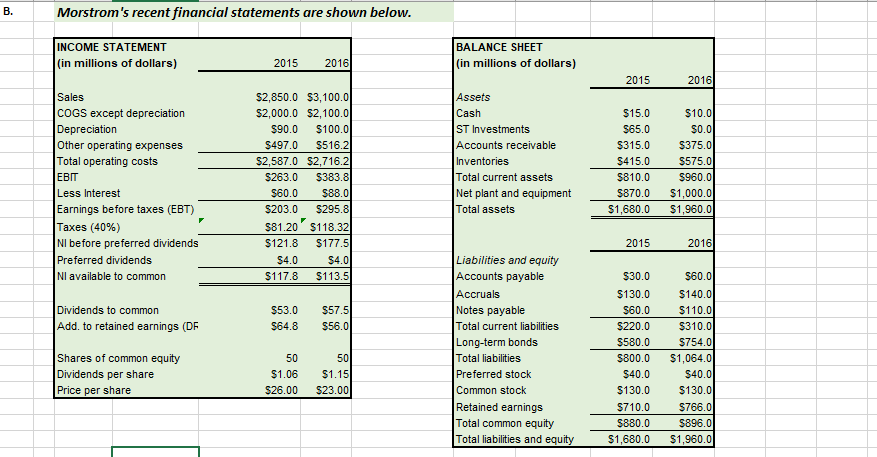
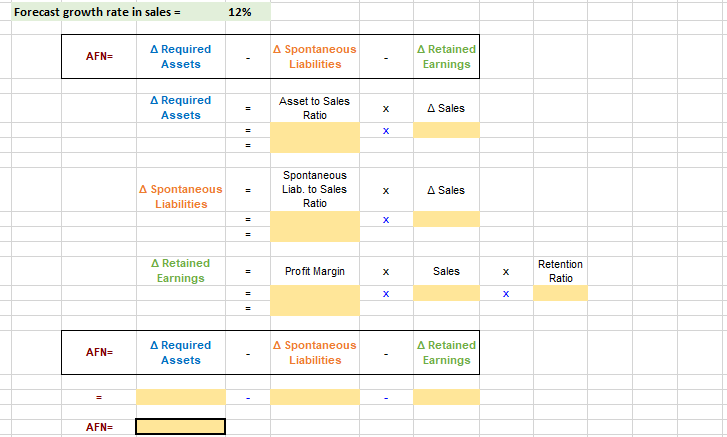
Calculate the cash conversion cycle for Cheap Goods Inc., given the following information: Sales $12,100,000 COGS $9,200,000 Inventor $1,700,000 AR $654,600 AP $654,300 Days/ye: 365 Cash conversion cycle (CCC) Inventory conversion period Receivables collection period Payables deferral period Inventory/Sales per day + AR/Sales per day - AP/COGS per day B. Morstrom's recent financial statements are shown below. INCOME STATEMENT (in millions of dollars) 2015 2016 BALANCE SHEET (in millions of dollars) 2015 2016 Sales COGS except depreciation Depreciation Other operating expenses Total operating costs EBIT Less Interest Earnings before taxes (EBT) Taxes (40%) NI before preferred dividends Preferred dividends Nl available to common $2,850.0 $3,100.0 $2,000.0 $2,100.0 $90.0 $100.0 $497.0 $516.2 $2,587.0 $2,716.21 $263.0 $383.8 $60.0 $88.01 $203.0 $295.8 $81.20 $118.32 $121.8 $177.51 $4.0 $4.01 $117.8 $113.5 Assets Cash ST Investments Accounts receivable Inventories Total current assets Net plant and equipment Total assets $15.0 $65.0 $315.0 $415.0 $810.0 $870.0 $1,680.0 $10.0 $0.0 $375.0 $575.0 $960.0 $1,000.0 $1,960.0 2015 2016 Dividends to common Add to retained earnings (DF $53.0 $64.8 $57.51 $56.01 Liabilities and equity Accounts payable Accruals Notes payable Total current liabilities Long-term bonds Total liabilities Preferred stock Common stock Retained earnings Total common equity Total liabilities and equity Shares of common equity Dividends per share Price per share 50 $1.06 $26.00 50 $1.151 $23.00 $30.0 $130.0 $60.0 $220.0 $580.0 $800.0 $40.0 $130.0 $710.0 $880.0 $1,680.0 $60.0 $140.0 $110.0 $310.00 $754.01 $1,064.0 $40.0 $130.0 $766.0 $896.0 $1,960.0 Forecast growth rate in sales - 12% AFN= A Required Assets A Spontaneous Liabilities A Retained Earnings A Required Assets Asset to Sales Ratio A Sales = Spontaneous Liab. to Sales Ratio A Spontaneous Liabilities A Sales A Retained Earnings Profit Margin Sales Retention Ratio AFN A Required Assets A Spontaneous Liabilities A Retained Earnings AFN Calculate the cash conversion cycle for Cheap Goods Inc., given the following information: Sales $12,100,000 COGS $9,200,000 Inventor $1,700,000 AR $654,600 AP $654,300 Days/ye: 365 Cash conversion cycle (CCC) Inventory conversion period Receivables collection period Payables deferral period Inventory/Sales per day + AR/Sales per day - AP/COGS per day B. Morstrom's recent financial statements are shown below. INCOME STATEMENT (in millions of dollars) 2015 2016 BALANCE SHEET (in millions of dollars) 2015 2016 Sales COGS except depreciation Depreciation Other operating expenses Total operating costs EBIT Less Interest Earnings before taxes (EBT) Taxes (40%) NI before preferred dividends Preferred dividends Nl available to common $2,850.0 $3,100.0 $2,000.0 $2,100.0 $90.0 $100.0 $497.0 $516.2 $2,587.0 $2,716.21 $263.0 $383.8 $60.0 $88.01 $203.0 $295.8 $81.20 $118.32 $121.8 $177.51 $4.0 $4.01 $117.8 $113.5 Assets Cash ST Investments Accounts receivable Inventories Total current assets Net plant and equipment Total assets $15.0 $65.0 $315.0 $415.0 $810.0 $870.0 $1,680.0 $10.0 $0.0 $375.0 $575.0 $960.0 $1,000.0 $1,960.0 2015 2016 Dividends to common Add to retained earnings (DF $53.0 $64.8 $57.51 $56.01 Liabilities and equity Accounts payable Accruals Notes payable Total current liabilities Long-term bonds Total liabilities Preferred stock Common stock Retained earnings Total common equity Total liabilities and equity Shares of common equity Dividends per share Price per share 50 $1.06 $26.00 50 $1.151 $23.00 $30.0 $130.0 $60.0 $220.0 $580.0 $800.0 $40.0 $130.0 $710.0 $880.0 $1,680.0 $60.0 $140.0 $110.0 $310.00 $754.01 $1,064.0 $40.0 $130.0 $766.0 $896.0 $1,960.0 Forecast growth rate in sales - 12% AFN= A Required Assets A Spontaneous Liabilities A Retained Earnings A Required Assets Asset to Sales Ratio A Sales = Spontaneous Liab. to Sales Ratio A Spontaneous Liabilities A Sales A Retained Earnings Profit Margin Sales Retention Ratio AFN A Required Assets A Spontaneous Liabilities A Retained Earnings AFN
Step by Step Solution
There are 3 Steps involved in it

Get step-by-step solutions from verified subject matter experts