

Question: PLEASE SHOW WORK! ALL INFORMATION IS PROVIDED! a. Perform horizontal analysis of the income statement and balance sheet data. Use 2017 as the base year.
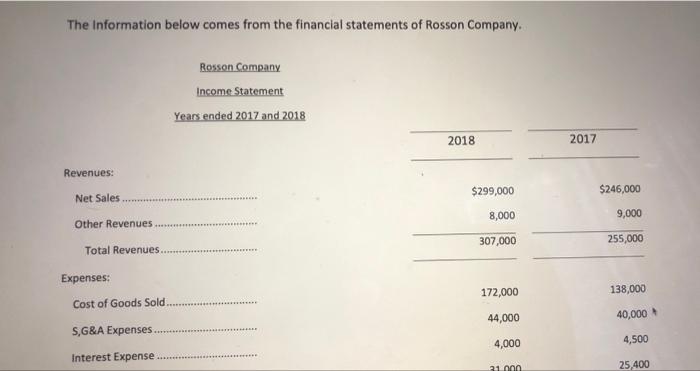
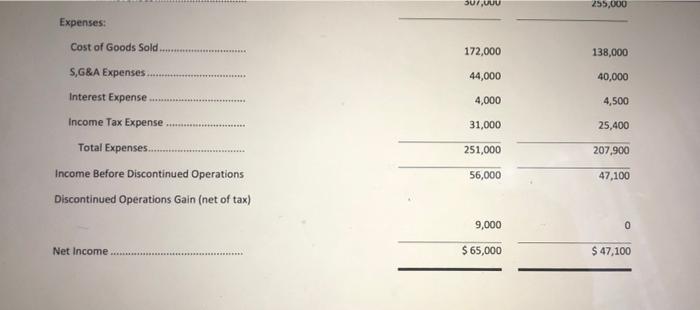
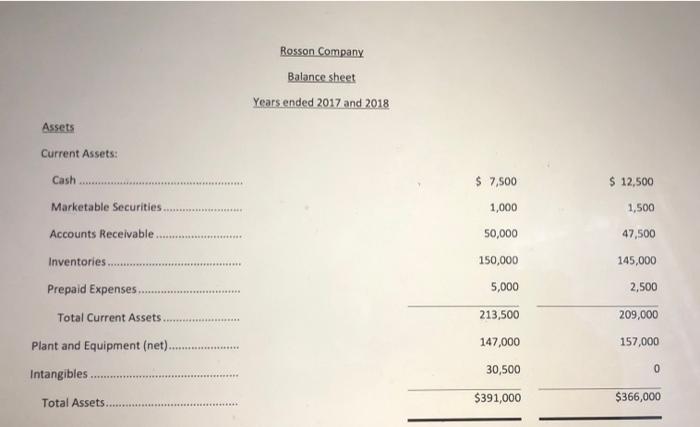
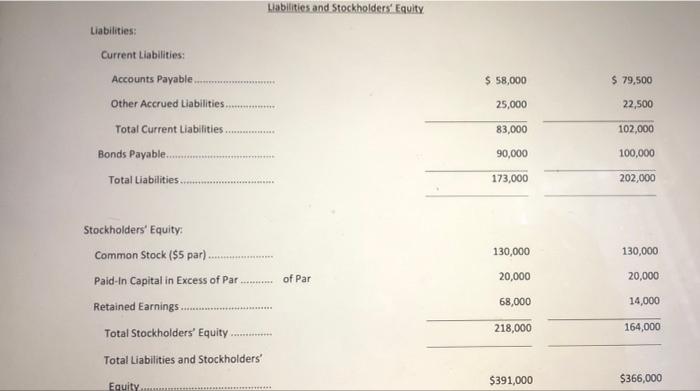
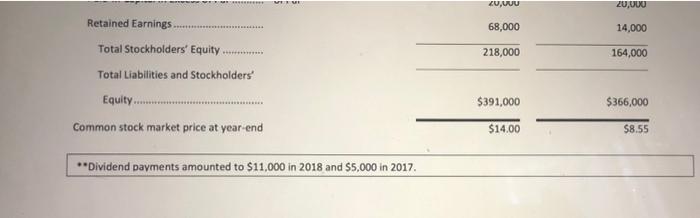
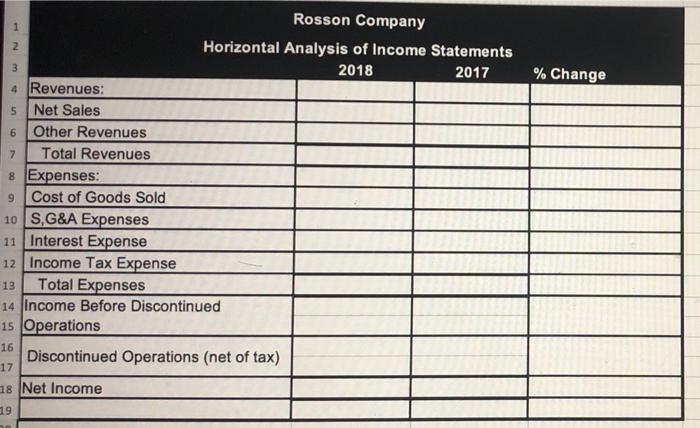
a. Perform horizontal analysis of the income statement and balance sheet data. Use 2017 as the base year. The Information below comes from the financial statements of Rosson Company. Rosson Company Income Statement Years ended 2017 and 2018 2018 2017 Revenues: $299,000 $246,000 Net Sales 8,000 9,000 Other Revenues 307,000 255,000 Total Revenues Expenses: 172,000 138,000 Cost of Goods Sold 44,000 40,000 S,G&A Expenses. 4,000 4,500 ER Interest Expense 31 0 25,400 Sur, 255,000 Expenses: Cost of Goods Sold 172,000 138,000 S,G&A Expenses. 44,000 40,000 Interest Expense 4,000 4,500 Income Tax Expense 31,000 25,400 251,000 207,900 Total Expenses... Income Before Discontinued Operations Discontinued Operations Gain (net of tax) 56,000 47,100 9,000 0 Net Income $ 65,000 $ 47,100 Rosson Company Balance sheet Years ended 2017 and 2018 Assets Current Assets: Cash ........ $ 7,500 $ 12,500 Marketable Securities 1,500 1,000 50,000 47,500 Accounts Receivable Inventories Prepaid Expenses....... Total Current Assets Plant and Equipment (net)........... Intangibles 150,000 5,000 213,500 147,000 145,000 2,500 209,000 157,000 ***** 0 30,500 $391,000 Total Assets $366,000 Liabilities and Stockholders' Equity Liabilities: Current Liabilities: Accounts Payable $ 58,000 $ 79,500 25,000 22,500 83,000 102,000 Other Accrued Liabilities..... Total Current Liabilities.......... Bonds Payable... Total Liabilities. 90,000 100,000 173,000 202,000 130,000 130,000 Stockholders' Equity Common Stock ($5 par) Paid-in Capital in Excess of Par Retained Earnings... Total Stockholders' Equity of Par 20,000 20,000 68,000 14,000 218,000 164,000 Total Liabilities and Stockholders' Equity $391,000 $366,000 ZUW 20,000 68,000 14,000 218,000 164,000 Retained Earnings Total Stockholders' Equity Total Liabilities and Stockholders' Equity Common stock market price at year-end $391,000 $366,000 $14.00 $8.55 "Dividend payments amounted to $11,000 in 2018 and $5,000 in 2017. 1 2 3 % Change 5 7 Rosson Company Horizontal Analysis of Income Statements 2018 2017 4 Revenues: Net Sales 6 Other Revenues Total Revenues 8 Expenses: 9 Cost of Goods Sold 10 S, G&A Expenses 11 Interest Expense 12 Income Tax Expense 13 Total Expenses 14 Income Before Discontinued 15 Operations 16 Discontinued Operations (net of tax) 17 18 Net Income 19
Step by Step Solution
There are 3 Steps involved in it

Get step-by-step solutions from verified subject matter experts