

Question: please show work and explain how you got the answer 5. Consider the following scatter plot that shows temperature vs number of ice cream sold,
please show work and explain how you got the answer
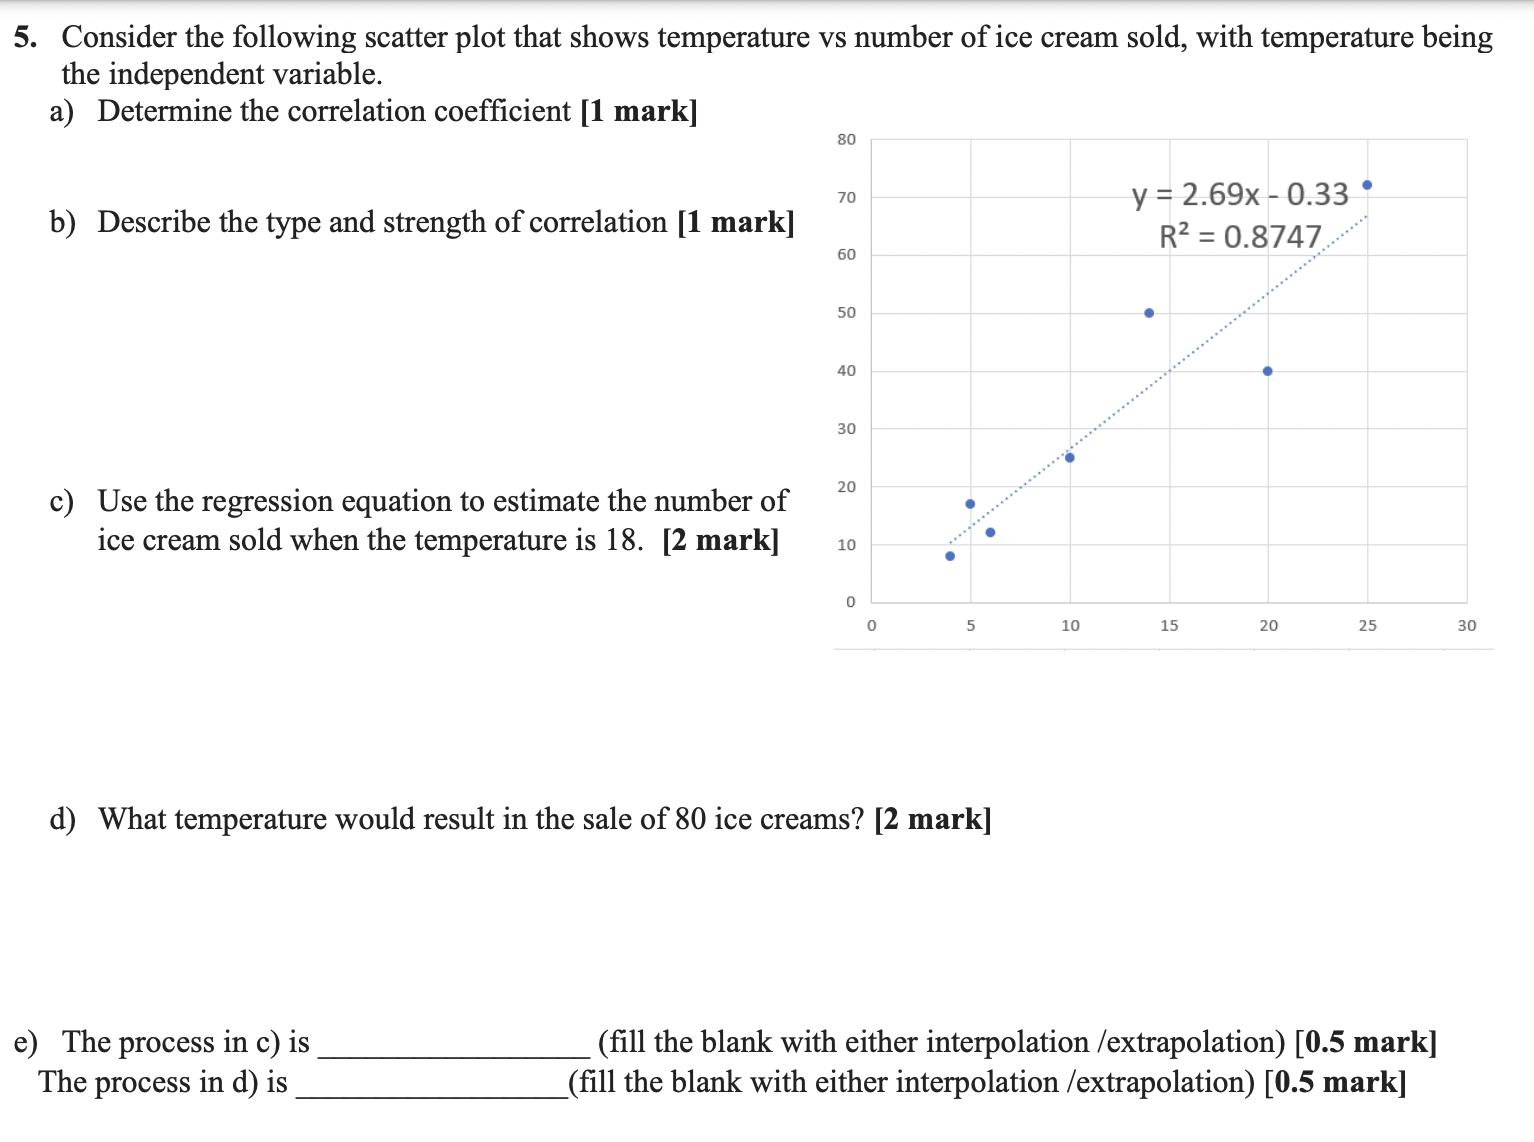
5. Consider the following scatter plot that shows temperature vs number of ice cream sold, with temperature being the independent variable. a) Determine the correlation coefficient [1 mark] 80 b) Describe the type and strength of correlation [1 mark] 70 y = 2.69x - 0.33 60 R2 = 0.8747 .....' 50 40 30 c) Use the regression equation to estimate the number of 20 ice cream sold when the temperature is 18. [2 mark] 10 0 5 10 15 20 25 30 d) What temperature would result in the sale of 80 ice creams? [2 mark] e) The process in c) is The process in d) is (fill the blank with either interpolation /extrapolation) [0.5 mark] (fill the blank with either interpolation /extrapolation) [0.5 mark]
Step by Step Solution
There are 3 Steps involved in it

Get step-by-step solutions from verified subject matter experts