

Question: Please show work and formulas 1 NOTES & ASSUMPTIONS 2 The tax rate is 40% 40% 3 Cash dividend of $2,600k declared & paid 4
Please show work and formulas
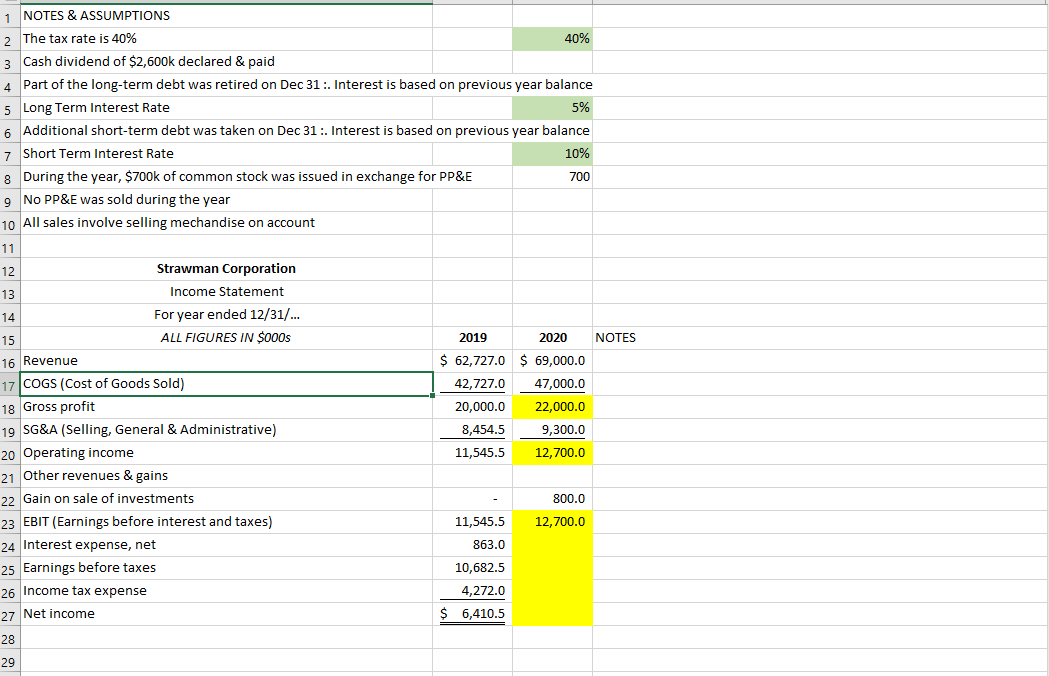
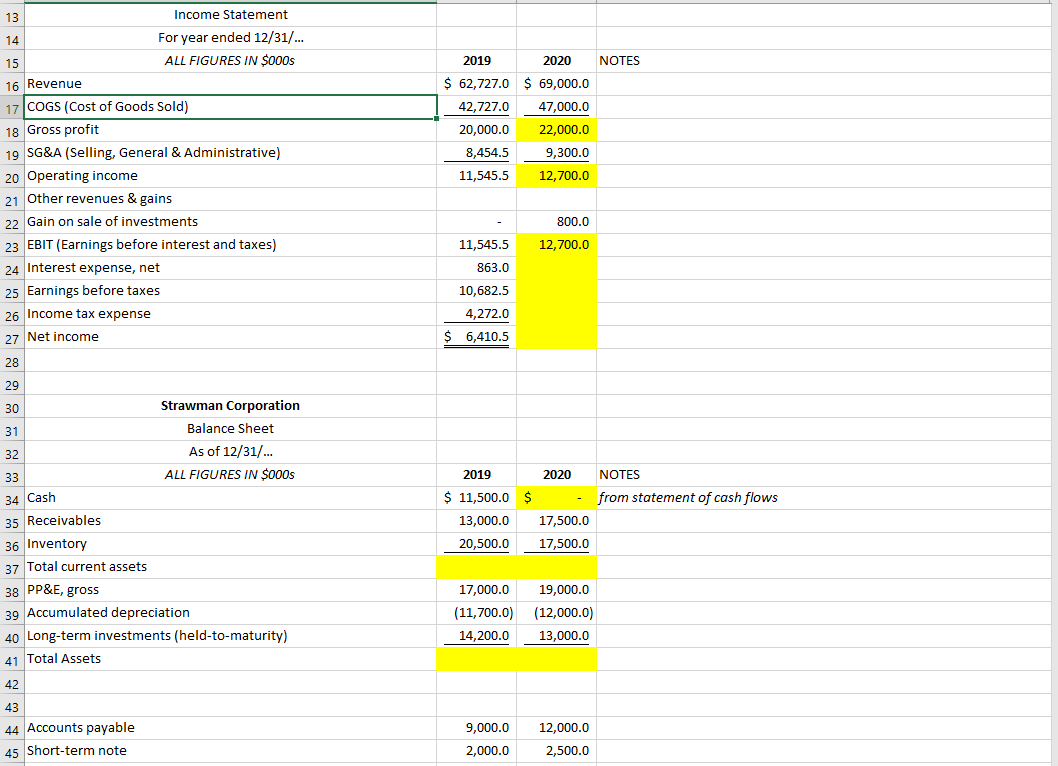
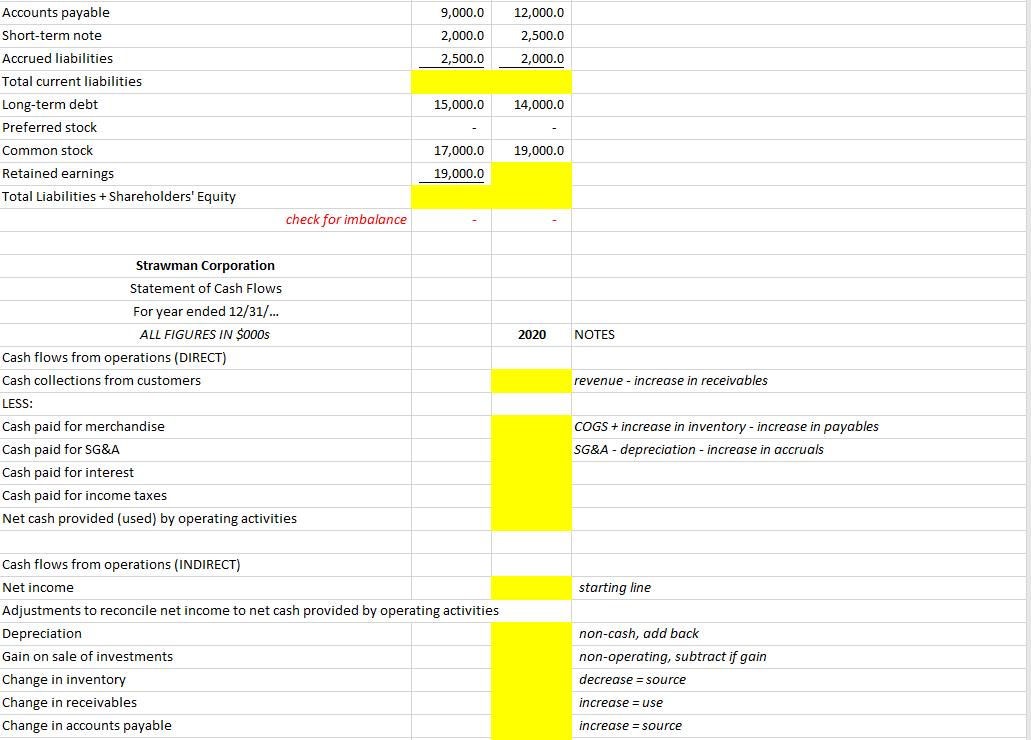
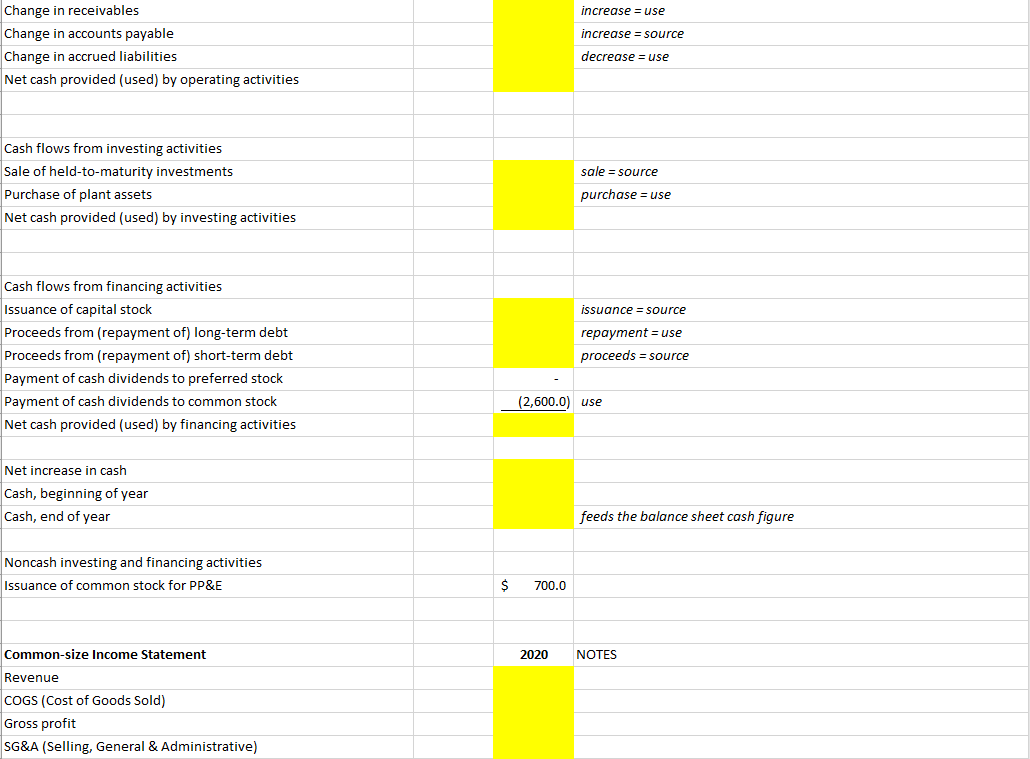
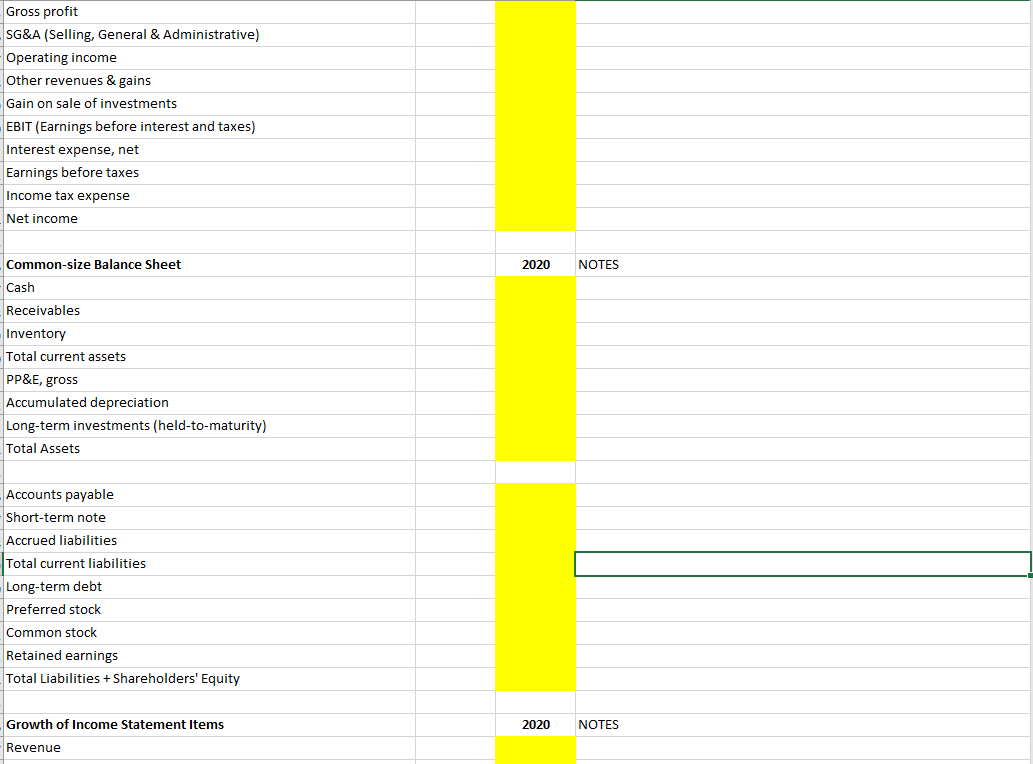
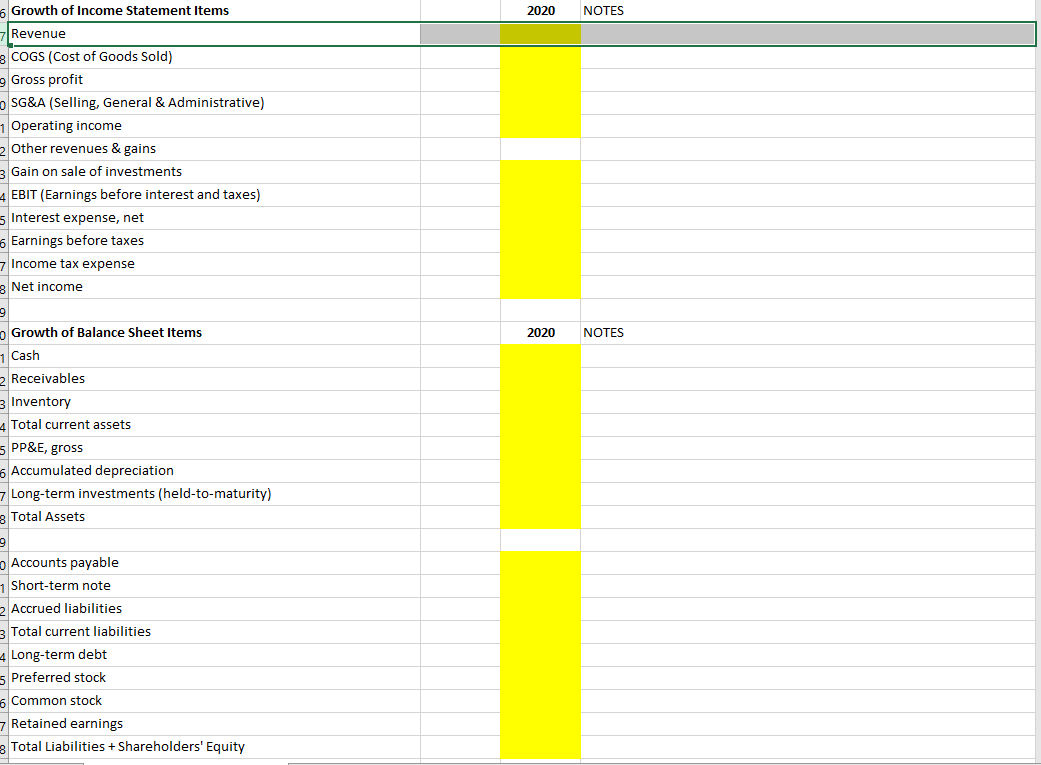
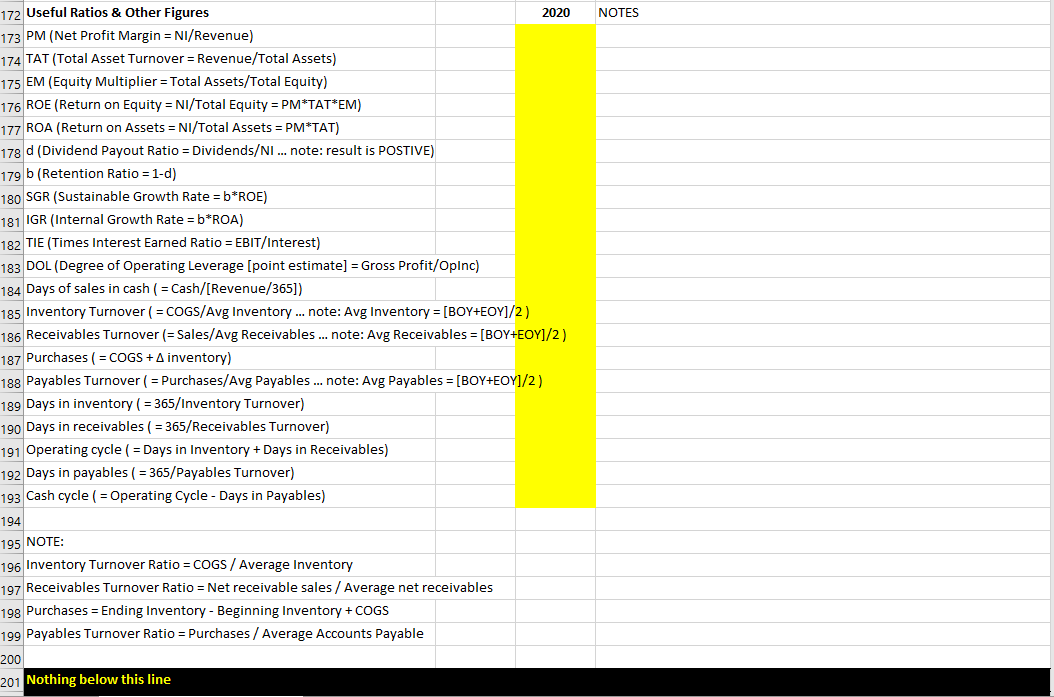
1 NOTES & ASSUMPTIONS 2 The tax rate is 40% 40% 3 Cash dividend of $2,600k declared & paid 4 Part of the long-term debt was retired on Dec 31:. Interest is based on previous year balance 5 Long Term Interest Rate 5% 6 Additional short-term debt was taken on Dec 31 :. Interest is based on previous year balance 7 Short Term Interest Rate 10% 8 During the year, $700k of common stock was issued in exchange for PP&E 700 9 No PP&E was sold during the year 10 All sales involve selling mechandise on account 11 12 Strawman Corporation 13 Income Statement 14 For year ended 12/31/... 15 ALL FIGURES IN $000s 2020 NOTES 16 Revenue $ 62,727.0 $ 69,000.0 17 COGS (Cost of Goods Sold) 42,727.0 47,000.0 18 Gross profit 20,000.0 22,000.0 19 SG&A (Selling, General & Administrative) 8,454.5 9,300.0 20 Operating income 11,545.5 12,700.0 21 Other revenues & gains 22 Gain on sale of investments 800.0 23 EBIT (Earnings before interest and taxes) 11,545.5 12,700.0 24 Interest expense, net 863.0 25 Earnings before taxes 10,682.5 26 Income tax expense 4,272.0 27 Net income $ 6,410.5 28 29 2019 2019 2020 NOTES 13 Income Statement 14 For year ended 12/31/... 15 ALL FIGURES IN $000s 16 Revenue 17 COGS (Cost of Goods Sold) 18 Gross profit 19 SG&A (Selling, General & Administrative) 20 Operating income 21 Other revenues & gains 22 Gain on sale of investments 23 EBIT (Earnings before interest and taxes) 24 Interest expense, net 25 Earnings before taxes 26 Income tax expense 27 Net income $ 62,727.0 $ 69,000.0 42,727.0 47,000.0 20,000.0 22,000.0 8,454.5 9,300.0 11,545.5 12,700.0 800.0 12,700.0 11,545.5 863.0 10,682.5 4,272.0 6,410.5 28 29 30 31 Strawman Corporation Balance Sheet As of 12/31/... ALL FIGURES IN $000s 32 2019 2020 NOTES 33 34 Cash 35 Receivables from statement of cash flows $ 11,500.0 $ 13,000.0 17,500.0 20,500.0 17,500.0 19,000.0 36 Inventory 37 Total current assets 38 PP&E, gross 39 Accumulated depreciation 40 Long-term investments (held-to-maturity) 41 Total Assets 17,000.0 (11,700.0) 14,200.0 (12,000.0) 13,000.0 42 43 44 Accounts payable 45 Short-term note 9,000.0 2,000.0 12,000.0 2,500.0 9,000.0 2,000.0 12,000.0 2,500.0 2,500.0 2,000.0 Accounts payable Short-term note Accrued liabilities Total current liabilities Long-term debt Preferred stock Common stock Retained earnings Total Liabilities + Shareholders' Equity 15,000.0 14,000.0 19,000.0 17,000.0 19,000.0 check for imbalance 2020 NOTES revenue - increase in receivables Strawman Corporation Statement of Cash Flows For year ended 12/31/... ALL FIGURES IN $000s Cash flows from operations (DIRECT) Cash collections from customers LESS: Cash paid for merchandise Cash paid for SG&A Cash paid for interest Cash paid for income taxes Net cash provided (used) by operating activities COGS + increase in inventory - increase in payables SG&A - depreciation - increase in accruals starting line Cash flows from operations (INDIRECT) Net income Adjustments to reconcile net income to net cash provided by operating activities Depreciation Gain on sale of investments Change in inventory Change in receivables Change in accounts payable non-cash, add back non-operating, subtract if gain decrease = source increase = use increase = source increase = use increase = source Change in receivables Change in accounts payable Change in accrued liabilities Net cash provided (used) by operating activities decrease = use sale = source Cash flows from investing activities Sale of held-to-maturity investments Purchase of plant assets Net cash provided (used) by investing activities purchase = use issuance = source Cash flows from financing activities Issuance of capital stock Proceeds from (repayment of) long-term debt Proceeds from (repayment of) short-term debt Payment of cash dividends to preferred stock Payment of cash dividends to common stock Net cash provided (used) by financing activities repayment = use proceeds = source (2,600.0) use Net increase in cash Cash, beginning of year Cash, end of year feeds the balance sheet cash figure Noncash investing and financing activities Issuance of common stock for PP&E $ 700.0 2020 NOTES Common-size Income Statement Revenue COGS (Cost of Goods Sold) Gross profit SG&A (Selling, General & Administrative) Gross profit SG&A (Selling, General & Administrative) Operating income Other revenues & gains Gain on sale of investments EBIT (Earnings before interest and taxes) Interest expense, net Earnings before taxes Income tax expense Net income Common-size Balance Sheet 2020 NOTES Cash Receivables Inventory Total current assets PP&E, gross Accumulated depreciation Long-term investments (held-to-maturity) Total Assets Accounts payable Short-term note Accrued liabilities Total current liabilities Long-term debt Preferred stock Common stock Retained earnings Total Liabilities + Shareholders' Equity 2020 NOTES Growth of Income Statement Items Revenue 2020 NOTES 2020 NOTES Growth of Income Statement Items Revenue COGS (Cost of Goods Sold) 9 Gross profit SG&A (Selling, General & Administrative) 1 Operating income 2 Other revenues & gains 3 Gain on sale of investments 4 EBIT (Earnings before interest and taxes) s Interest expense, net 6 Earnings before taxes 7 Income tax expense 3 Net income 9 o Growth of Balance Sheet Items 1 Cash 2 Receivables 3 Inventory 4 Total current assets SPP&E, gross 6 Accumulated depreciation 7 Long-term investments (held-to-maturity) 3 Total Assets 9 Accounts payable 1 Short-term note Accrued liabilities 3 Total current liabilities 4 Long-term debt s Preferred stock 6 Common stock 7 Retained earnings 3 Total Liabilities + Shareholders' Equity NOTES 172 Useful Ratios & Other Figures 2020 173 PM (Net Profit Margin = NI/Revenue) 174 TAT (Total Asset Turnover = Revenue/Total Assets) 175 EM (Equity Multiplier = Total Assets/Total Equity) 176 ROE (Return on Equity = NI/Total Equity = PM*TAT*EM) 177 ROA (Return on Assets = NI/Total Assets = PM*TAT) 178 d (Dividend Payout Ratio = Dividends/Ni ... note: result is POSTIVE) 179 b (Retention Ratio - 1-d) 180 SGR (Sustainable Growth Rate = b*ROE) 181 IGR (Internal Growth Rate = b*ROA) 182 TIE (Times Interest Earned Ratio = EBIT/Interest) 183 DOL (Degree of Operating Leverage [point estimate] = Gross Profit/Opinc) 184 Days of sales in cash ( = Cash/[Revenue/365]) 185 Inventory Turnover ( = COGS/Avg Inventory ... note: Avg Inventory = [BOY+EOY]/2) 186 Receivables Turnover (=Sales/Avg Receivables ... note: Avg Receivables = [BOY+EOY]/2) 187 Purchases ( = COGS + A inventory) 188 Payables Turnover ( = Purchases/Avg Payables ... note: Avg Payables = [BOY+EOY]/2) 189 Days in inventory ( = 365/Inventory Turnover) 190 Days in receivables ( = 365/Receivables Turnover) 191 Operating cycle ( = Days in Inventory + Days in Receivables) 192 Days in payables ( = 365/Payables Turnover) 193 Cash cycle ( = Operating Cycle - Days in Payables) 194 195 NOTE: 196 Inventory Turnover Ratio = COGS / Average Inventory 197 Receivables Turnover Ratio = Net receivable sales / Average net receivables 198 Purchases = Ending Inventory - Beginning Inventory + COGS 199 Payables Turnover Ratio = Purchases / Average Accounts Payable 200 201 Nothing below this line 1 NOTES & ASSUMPTIONS 2 The tax rate is 40% 40% 3 Cash dividend of $2,600k declared & paid 4 Part of the long-term debt was retired on Dec 31:. Interest is based on previous year balance 5 Long Term Interest Rate 5% 6 Additional short-term debt was taken on Dec 31 :. Interest is based on previous year balance 7 Short Term Interest Rate 10% 8 During the year, $700k of common stock was issued in exchange for PP&E 700 9 No PP&E was sold during the year 10 All sales involve selling mechandise on account 11 12 Strawman Corporation 13 Income Statement 14 For year ended 12/31/... 15 ALL FIGURES IN $000s 2020 NOTES 16 Revenue $ 62,727.0 $ 69,000.0 17 COGS (Cost of Goods Sold) 42,727.0 47,000.0 18 Gross profit 20,000.0 22,000.0 19 SG&A (Selling, General & Administrative) 8,454.5 9,300.0 20 Operating income 11,545.5 12,700.0 21 Other revenues & gains 22 Gain on sale of investments 800.0 23 EBIT (Earnings before interest and taxes) 11,545.5 12,700.0 24 Interest expense, net 863.0 25 Earnings before taxes 10,682.5 26 Income tax expense 4,272.0 27 Net income $ 6,410.5 28 29 2019 2019 2020 NOTES 13 Income Statement 14 For year ended 12/31/... 15 ALL FIGURES IN $000s 16 Revenue 17 COGS (Cost of Goods Sold) 18 Gross profit 19 SG&A (Selling, General & Administrative) 20 Operating income 21 Other revenues & gains 22 Gain on sale of investments 23 EBIT (Earnings before interest and taxes) 24 Interest expense, net 25 Earnings before taxes 26 Income tax expense 27 Net income $ 62,727.0 $ 69,000.0 42,727.0 47,000.0 20,000.0 22,000.0 8,454.5 9,300.0 11,545.5 12,700.0 800.0 12,700.0 11,545.5 863.0 10,682.5 4,272.0 6,410.5 28 29 30 31 Strawman Corporation Balance Sheet As of 12/31/... ALL FIGURES IN $000s 32 2019 2020 NOTES 33 34 Cash 35 Receivables from statement of cash flows $ 11,500.0 $ 13,000.0 17,500.0 20,500.0 17,500.0 19,000.0 36 Inventory 37 Total current assets 38 PP&E, gross 39 Accumulated depreciation 40 Long-term investments (held-to-maturity) 41 Total Assets 17,000.0 (11,700.0) 14,200.0 (12,000.0) 13,000.0 42 43 44 Accounts payable 45 Short-term note 9,000.0 2,000.0 12,000.0 2,500.0 9,000.0 2,000.0 12,000.0 2,500.0 2,500.0 2,000.0 Accounts payable Short-term note Accrued liabilities Total current liabilities Long-term debt Preferred stock Common stock Retained earnings Total Liabilities + Shareholders' Equity 15,000.0 14,000.0 19,000.0 17,000.0 19,000.0 check for imbalance 2020 NOTES revenue - increase in receivables Strawman Corporation Statement of Cash Flows For year ended 12/31/... ALL FIGURES IN $000s Cash flows from operations (DIRECT) Cash collections from customers LESS: Cash paid for merchandise Cash paid for SG&A Cash paid for interest Cash paid for income taxes Net cash provided (used) by operating activities COGS + increase in inventory - increase in payables SG&A - depreciation - increase in accruals starting line Cash flows from operations (INDIRECT) Net income Adjustments to reconcile net income to net cash provided by operating activities Depreciation Gain on sale of investments Change in inventory Change in receivables Change in accounts payable non-cash, add back non-operating, subtract if gain decrease = source increase = use increase = source increase = use increase = source Change in receivables Change in accounts payable Change in accrued liabilities Net cash provided (used) by operating activities decrease = use sale = source Cash flows from investing activities Sale of held-to-maturity investments Purchase of plant assets Net cash provided (used) by investing activities purchase = use issuance = source Cash flows from financing activities Issuance of capital stock Proceeds from (repayment of) long-term debt Proceeds from (repayment of) short-term debt Payment of cash dividends to preferred stock Payment of cash dividends to common stock Net cash provided (used) by financing activities repayment = use proceeds = source (2,600.0) use Net increase in cash Cash, beginning of year Cash, end of year feeds the balance sheet cash figure Noncash investing and financing activities Issuance of common stock for PP&E $ 700.0 2020 NOTES Common-size Income Statement Revenue COGS (Cost of Goods Sold) Gross profit SG&A (Selling, General & Administrative) Gross profit SG&A (Selling, General & Administrative) Operating income Other revenues & gains Gain on sale of investments EBIT (Earnings before interest and taxes) Interest expense, net Earnings before taxes Income tax expense Net income Common-size Balance Sheet 2020 NOTES Cash Receivables Inventory Total current assets PP&E, gross Accumulated depreciation Long-term investments (held-to-maturity) Total Assets Accounts payable Short-term note Accrued liabilities Total current liabilities Long-term debt Preferred stock Common stock Retained earnings Total Liabilities + Shareholders' Equity 2020 NOTES Growth of Income Statement Items Revenue 2020 NOTES 2020 NOTES Growth of Income Statement Items Revenue COGS (Cost of Goods Sold) 9 Gross profit SG&A (Selling, General & Administrative) 1 Operating income 2 Other revenues & gains 3 Gain on sale of investments 4 EBIT (Earnings before interest and taxes) s Interest expense, net 6 Earnings before taxes 7 Income tax expense 3 Net income 9 o Growth of Balance Sheet Items 1 Cash 2 Receivables 3 Inventory 4 Total current assets SPP&E, gross 6 Accumulated depreciation 7 Long-term investments (held-to-maturity) 3 Total Assets 9 Accounts payable 1 Short-term note Accrued liabilities 3 Total current liabilities 4 Long-term debt s Preferred stock 6 Common stock 7 Retained earnings 3 Total Liabilities + Shareholders' Equity NOTES 172 Useful Ratios & Other Figures 2020 173 PM (Net Profit Margin = NI/Revenue) 174 TAT (Total Asset Turnover = Revenue/Total Assets) 175 EM (Equity Multiplier = Total Assets/Total Equity) 176 ROE (Return on Equity = NI/Total Equity = PM*TAT*EM) 177 ROA (Return on Assets = NI/Total Assets = PM*TAT) 178 d (Dividend Payout Ratio = Dividends/Ni ... note: result is POSTIVE) 179 b (Retention Ratio - 1-d) 180 SGR (Sustainable Growth Rate = b*ROE) 181 IGR (Internal Growth Rate = b*ROA) 182 TIE (Times Interest Earned Ratio = EBIT/Interest) 183 DOL (Degree of Operating Leverage [point estimate] = Gross Profit/Opinc) 184 Days of sales in cash ( = Cash/[Revenue/365]) 185 Inventory Turnover ( = COGS/Avg Inventory ... note: Avg Inventory = [BOY+EOY]/2) 186 Receivables Turnover (=Sales/Avg Receivables ... note: Avg Receivables = [BOY+EOY]/2) 187 Purchases ( = COGS + A inventory) 188 Payables Turnover ( = Purchases/Avg Payables ... note: Avg Payables = [BOY+EOY]/2) 189 Days in inventory ( = 365/Inventory Turnover) 190 Days in receivables ( = 365/Receivables Turnover) 191 Operating cycle ( = Days in Inventory + Days in Receivables) 192 Days in payables ( = 365/Payables Turnover) 193 Cash cycle ( = Operating Cycle - Days in Payables) 194 195 NOTE: 196 Inventory Turnover Ratio = COGS / Average Inventory 197 Receivables Turnover Ratio = Net receivable sales / Average net receivables 198 Purchases = Ending Inventory - Beginning Inventory + COGS 199 Payables Turnover Ratio = Purchases / Average Accounts Payable 200 201 Nothing below this line
Step by Step Solution
There are 3 Steps involved in it

Get step-by-step solutions from verified subject matter experts