

Question: PLEASE SHOW WORK AND GRAPH FOR A LIKE!!!!!! 4 (a) (b) (e) (d) 4. (10 points) A systems specialist has studied the workow of clerks
PLEASE SHOW WORK AND GRAPH FOR A LIKE!!!!!!
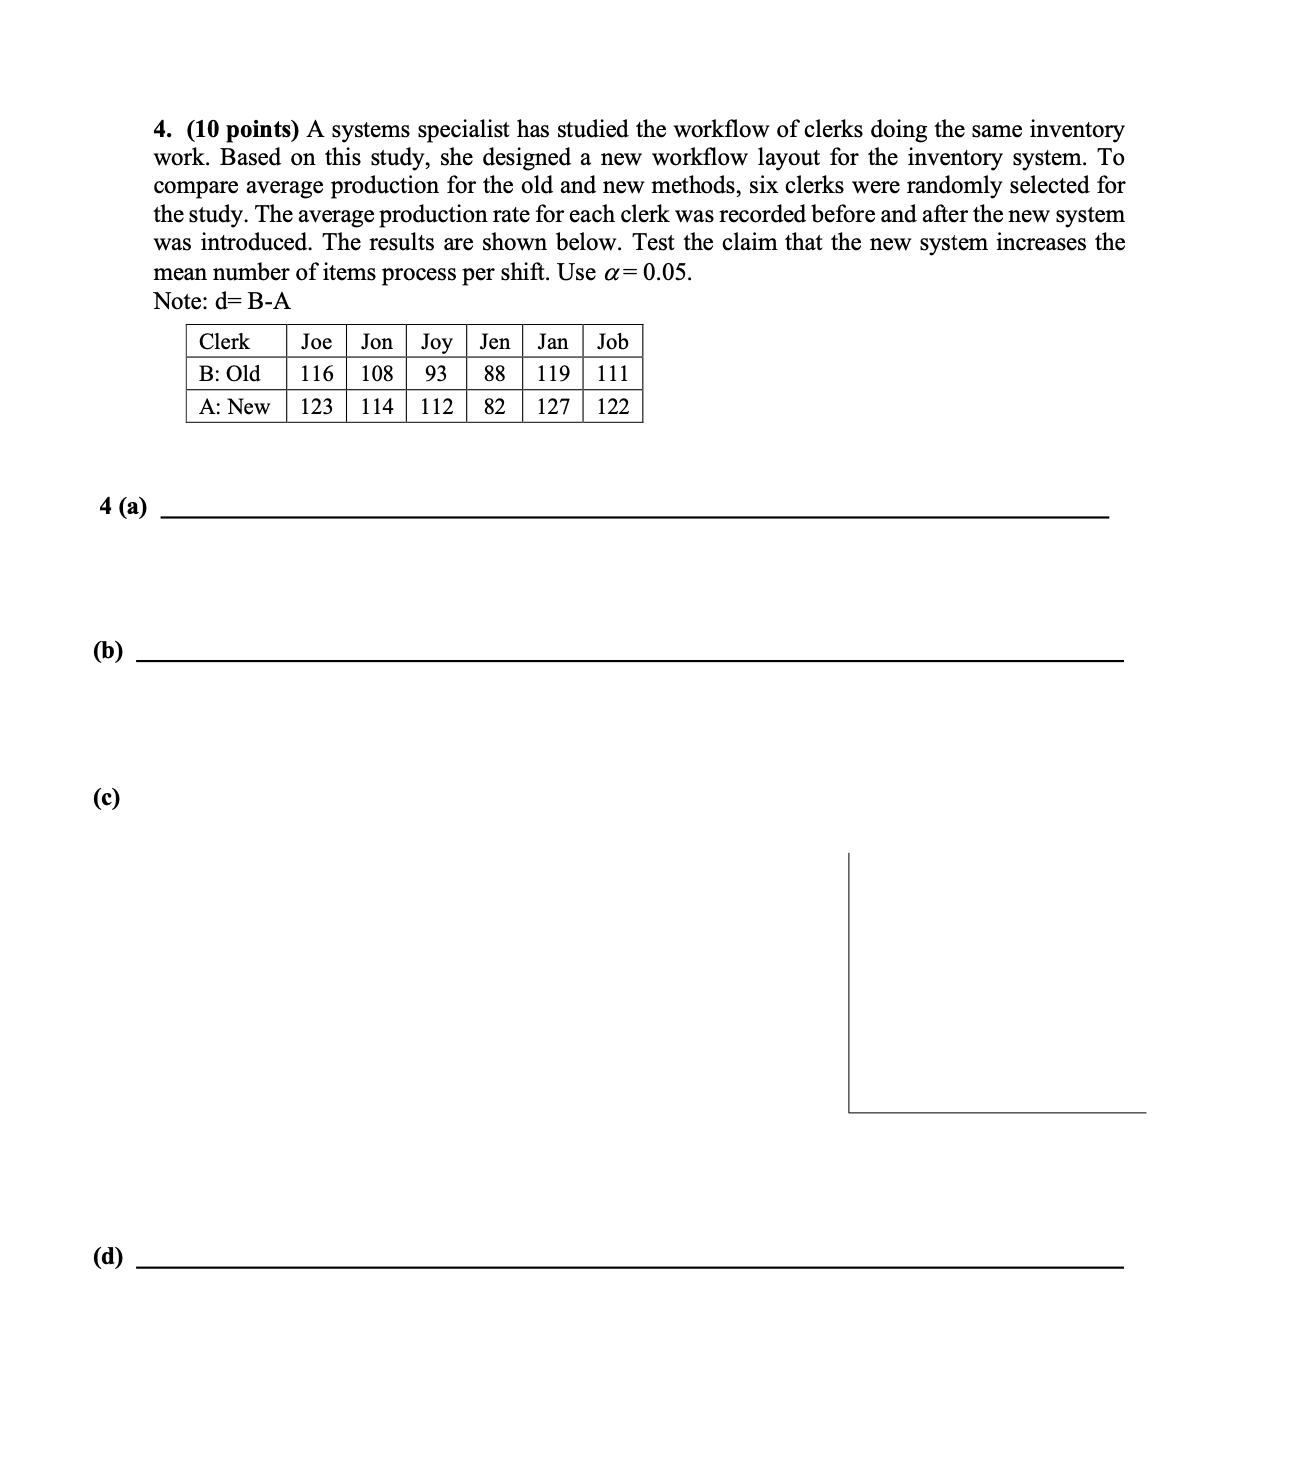
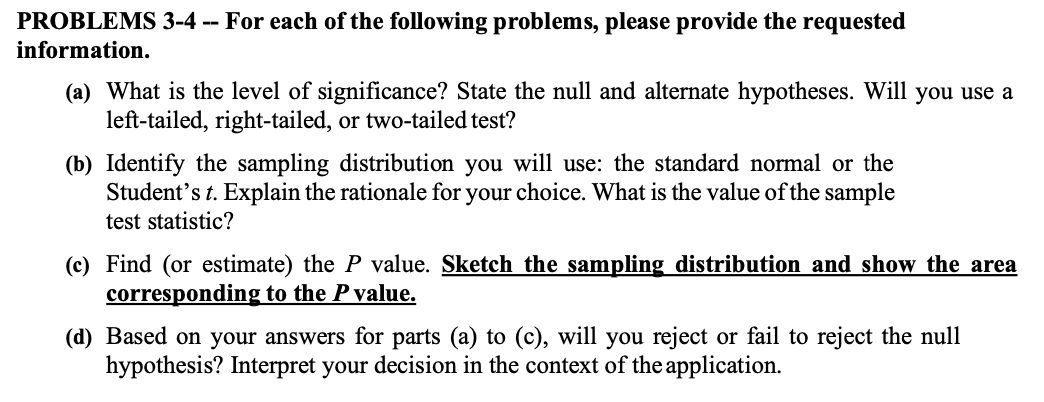
4 (a) (b) (e) (d) 4. (10 points) A systems specialist has studied the workow of clerks doing the same inventory work. Based on this study, she designed a new workow layout for the inventory system. To compare average production for the old and new methods, six clerks were randomly selected for the study. The average production rate for each clerk was recorded before and after the new system was introduced. The results are shown below. Test the claim that the new system increases the mean number of items process per shift. Use a: 0.05. Note: d=B-A Clerk Joe Joy Jen Jan Job W 116 ms AzNew 114 112 82 127 122 PROBLEMS 3-4 For each of the following problems, please provide the requested information. (a) What is the level of signicance? State the null and alternate hypotheses. Will you use a left-tailed, right-tailed, or two-tailed test? (b) Identify the sampling distribution you will use: the standard normal or the Student's t. Explain the rationale for your choice. What is the value of the sample test statistic? (c) Find (or estimate) the P value. Sketch the sampling distribution and show the area corresponding to the Pvalue. (d) Based on your answers for parts (a) to (c), will you reject or fail to reject the null hypothesis? Interpret your decision in the context of the application
Step by Step Solution
There are 3 Steps involved in it

Get step-by-step solutions from verified subject matter experts