

Question: Please Show Work/ Calculations Question #2 NPV/MARR: 4) A. Which of the four NPV charts below, generated by 100 simulations, represents the highest probability for
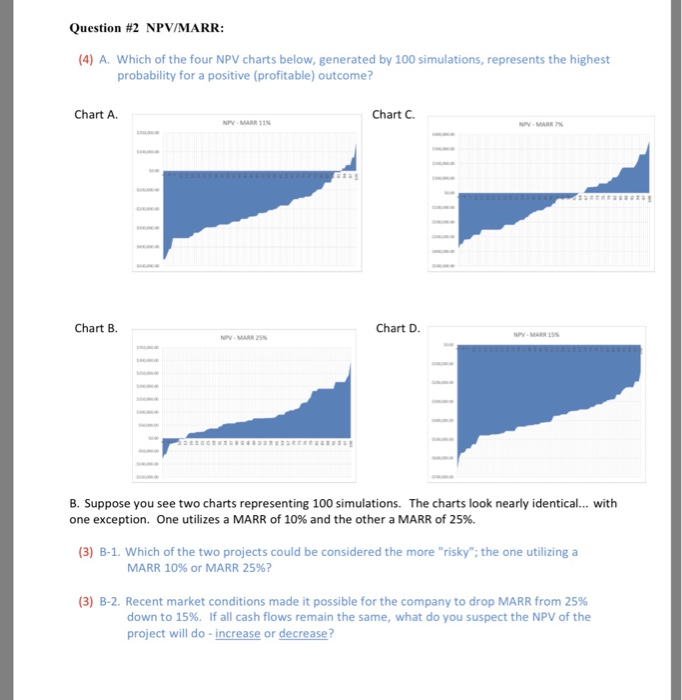
Question #2 NPV/MARR: 4) A. Which of the four NPV charts below, generated by 100 simulations, represents the highest probability for a positive (profitable) outcome? Chart A Chart C Chart B. Chart D B. Suppose you see two charts representing 100 simulations. The charts look nearly identical... with one exception. One utilizes a MARR of 10% and the other a MARR of 25%. (3) B-1. Which of the two projects could be considered the more "risky": the one utilizing a MARR 10% or MARR 25%? (3) B-2. Recent market conditions made it possible for the company to drop MARR from 25% down to 15%. If all cash flows remain the same, what do you suspect the NPV of the project will do-increase or decrease
Step by Step Solution
There are 3 Steps involved in it

Get step-by-step solutions from verified subject matter experts