

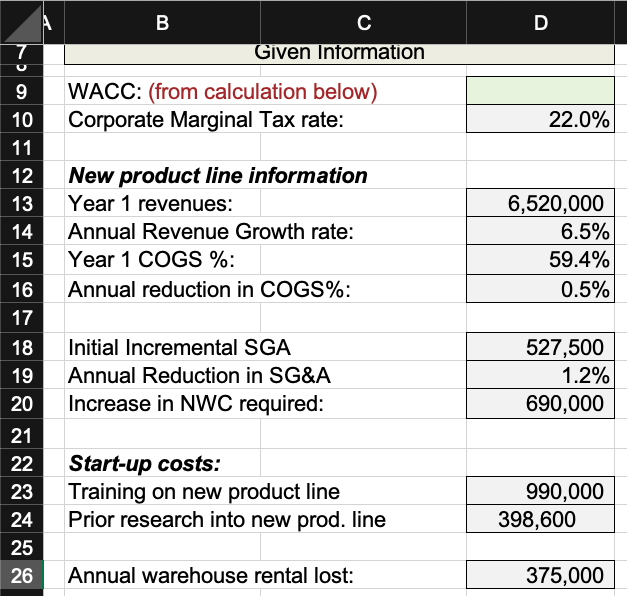
Question: Please show work/ equations! 9 10 Given Information WACC: (from calculation below) Corporate Marginal Tax rate: 22.0% 11. 12 | New product line information 13
 Please show work/ equations!
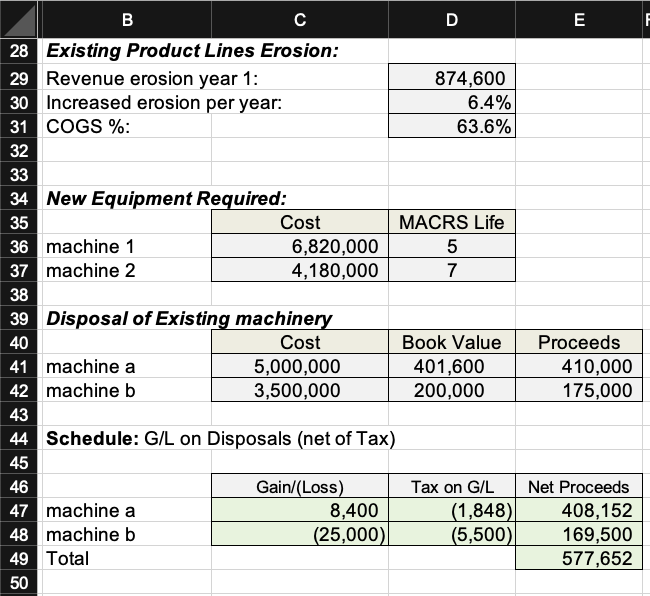
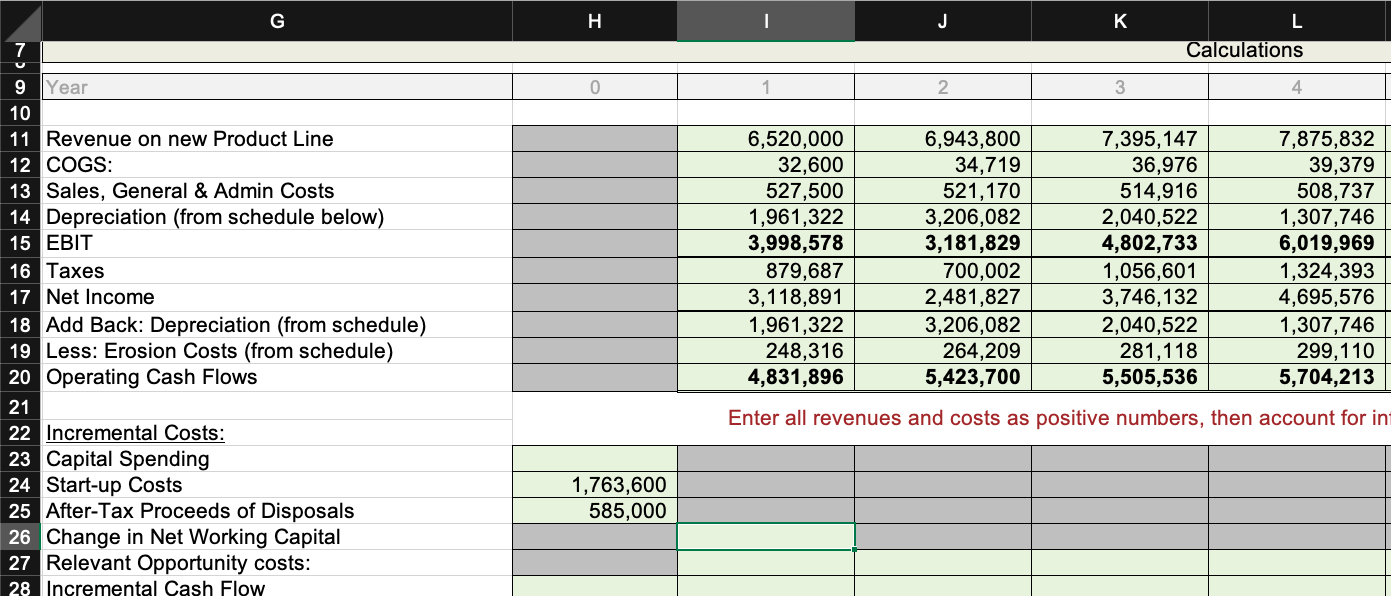
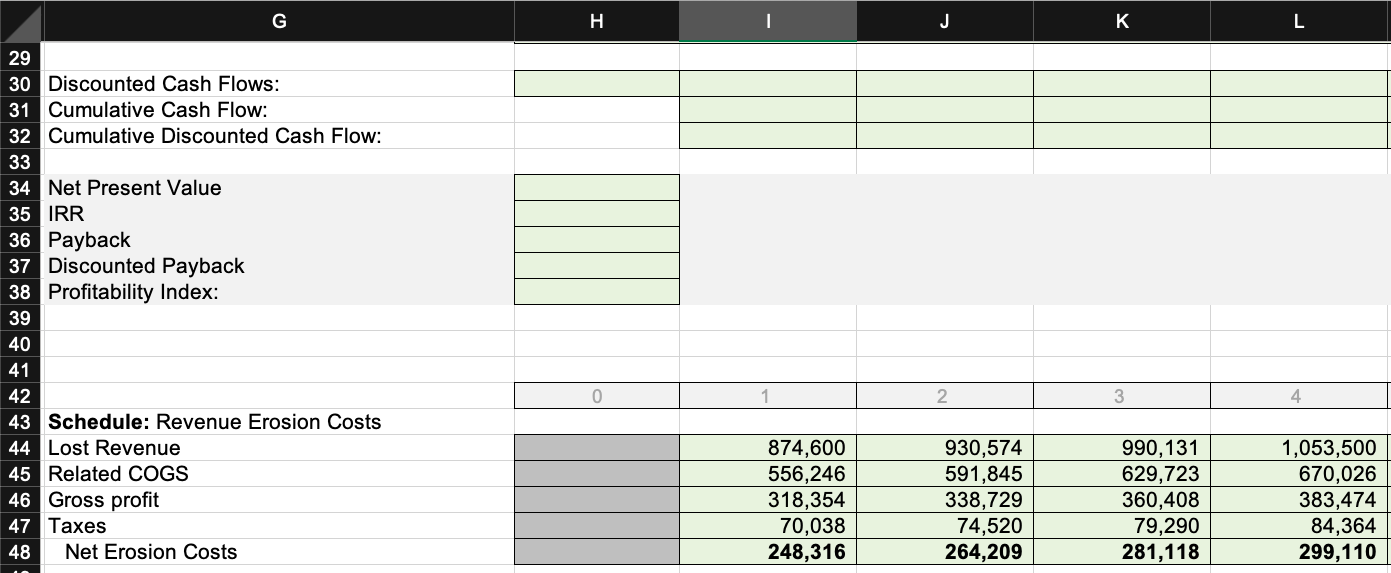
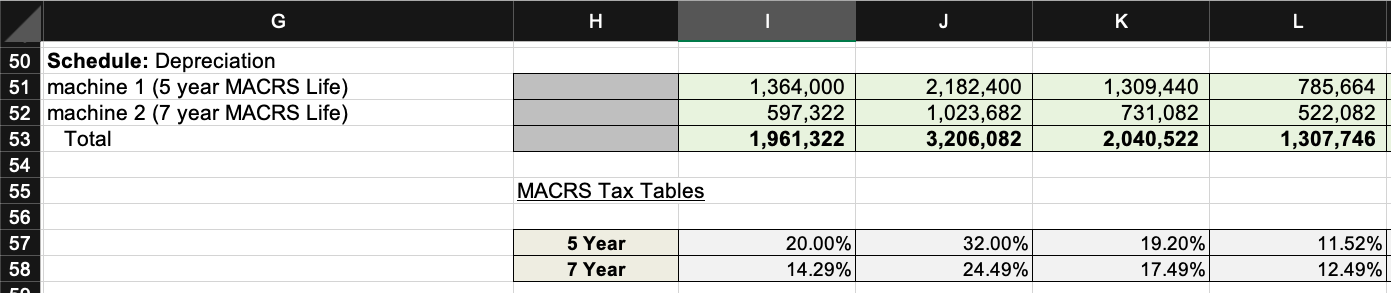
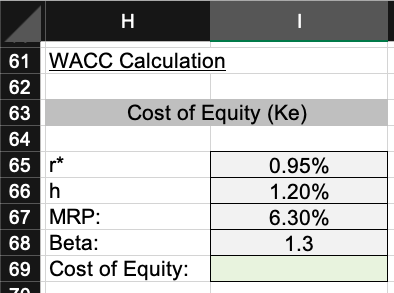
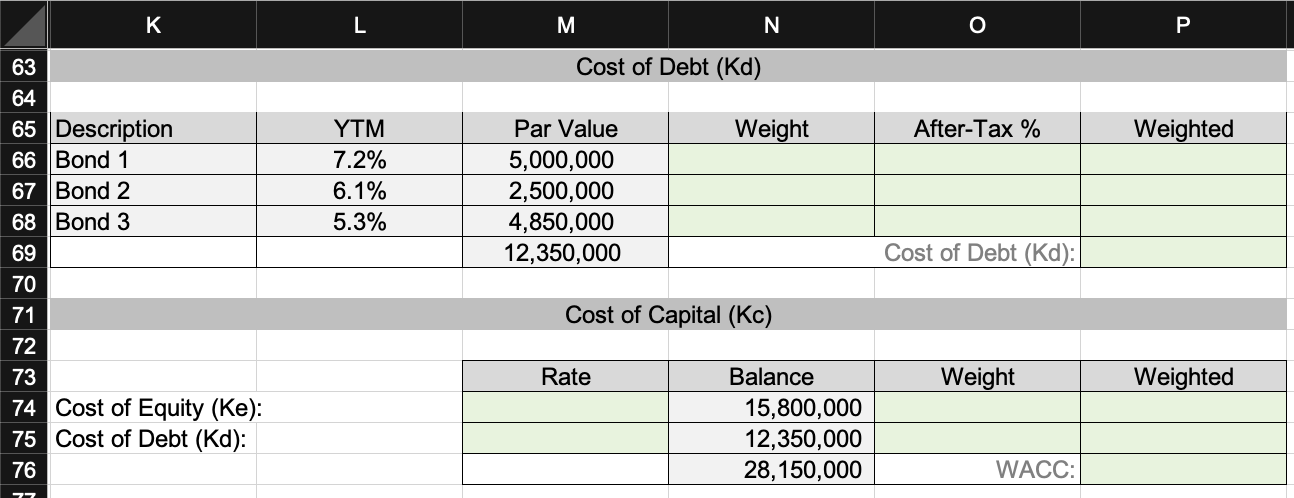
9 10 Given Information WACC: (from calculation below) Corporate Marginal Tax rate: 22.0% 11. 12 | New product line information 13 Year 1 revenues: Annual Revenue Growth rate: 15 Year 1 COGS %: 16 Annual reduction in COGS%: 14 6,520,000 6.5% 59.4% 0.5% 17 18 19 20 21 22 Initial Incremental SGA Annual Reduction in SG&A Increase in NWC required: 527,500 1.2% 690,000 23 Start-up costs: Training on new product line Prior research into new prod. line 990,000 398,600 24 25 26 Annual warehouse rental lost: 375,000 D 29 28 Existing Product Lines Erosion: Revenue erosion year 1: 30 Increased erosion per year: COGS %: 874,600 6.4% 63.6% 33 34 New Equipment Required: 35 Cost 36 machine 1 6,820,000 37 machine 2 4,180,000 MACRS Life 5 7 38 40 Disposal of Existing machinery Cost 41 machine a 5,000,000 42 machine b 3,500,000 * # Book Value 401,600 200,000 3 Proceeds 410,000 175,000 44 Schedule: G/L on Disposals (net of Tax) 45 46 47 machine a 48 machine b 49 Total Gain/(Loss) 8,400 (25,000) Tax on G/L (1,848) (5,500) Net Proceeds 408,152 169,500 577,652 H. Calculations 0 1 7 Year 10 11 Revenue on new Product Line 12 COGS: 13 Sales, General & Admin Costs 14 Depreciation (from schedule below) 15 EBIT 16 Taxes 17 Net Income 18 Add Back: Depreciation (from schedule) 19 Less: Erosion Costs (from schedule) 20 Operating Cash Flows 6,520,000 32,600 527,500 1,961,322 3,998,578 879,687 3,118,891 1,961,322 248.316 4,831,896 6,943,800 34,719 521, 170 3,206,082 3,181,829 700,002 2,481,827 3,206,082 264,209 5,423,700 7,395,147 36,976 514,916 2,040,522 4,802,733 1,056,601 3,746,132 2,040,522 281,118 5,505,536 ,875,832 39,379 508,737|| 1,307,746 6,019,969 1,324,393 4,695,576 1,307,746 299, 110 5,704,213 21 Enter all revenues and costs as positive numbers, then account for in 22 Incremental Costs: 23 Capital Spending 24 Start-up Costs 25 After-Tax Proceeds of Disposals 26 Change in Net Working Capital 27 Relevant Opportunity costs: 28 Incremental Cash Flow 1,763,600 585,000 H I J K L 29 30 Discounted Cash Flows: 31 Cumulative Cash Flow: 32 Cumulative Discounted Cash Flow: 33 34 Net Present Value 35 IRR 36 Payback 37 Discounted Payback 38 Profitability Index: 39 40 0 1 2 3 4 41 42 43 Schedule: Revenue Erosion Costs 44 Lost Revenue 45 Related COGS 46 Gross profit 47 Taxes 48 Net Erosion Costs 874,600 556,246 318,354 70,038 248,316 930,574 591,845 338,729 74,520 264,209 990, 131 629,723 360,408 79,290 281,118 1,053,500 670,026 383,474 84,364 299,110 L 1,364,000 597,322 1,961,322 2,182,400 1,023,682 3,206,082 1,309,440 731,082 2,040,522 785,664 522,082 1,307,746 50 Schedule: Depreciation 51 machine 1 (5 year MACRS Life) 52 machine 2 (7 year MACRS Life) 53 Total 54 55 56 57 58 MACRS Tax Tables 5 Year 7 Year 20.00% 14.29% 32.00% 24.49% 19.20% 17.49% 11.52% 12.49% ro 61 WACC Calculation 62 63 Cost of Equity (Ke) 64 65 r* 66 h 67 MRP: 68 Beta: 69 Cost of Equity: 0.95% 1.20% 6.30% 1.3 zo No Cost of Debt (Kd) Weight After-Tax % Weighted YTM 7.2% 6.1% 5.3% | 63 64 65 Description 66 Bond 1 67 Bond 2 68 Bond 3 69 70 71 72 73 74 Cost of Equity (Ke): 75 Cost of Debt (Kd): 76 Par Value 5,000,000 2,500,000 4,850,000 12,350,000 Cost of Debt (Kd): Cost of Capital (Kc) Rate Weight Weighted Balance 15,800,000 12,350,000 28,150,000 WACC: 9 10 Given Information WACC: (from calculation below) Corporate Marginal Tax rate: 22.0% 11. 12 | New product line information 13 Year 1 revenues: Annual Revenue Growth rate: 15 Year 1 COGS %: 16 Annual reduction in COGS%: 14 6,520,000 6.5% 59.4% 0.5% 17 18 19 20 21 22 Initial Incremental SGA Annual Reduction in SG&A Increase in NWC required: 527,500 1.2% 690,000 23 Start-up costs: Training on new product line Prior research into new prod. line 990,000 398,600 24 25 26 Annual warehouse rental lost: 375,000 D 29 28 Existing Product Lines Erosion: Revenue erosion year 1: 30 Increased erosion per year: COGS %: 874,600 6.4% 63.6% 33 34 New Equipment Required: 35 Cost 36 machine 1 6,820,000 37 machine 2 4,180,000 MACRS Life 5 7 38 40 Disposal of Existing machinery Cost 41 machine a 5,000,000 42 machine b 3,500,000 * # Book Value 401,600 200,000 3 Proceeds 410,000 175,000 44 Schedule: G/L on Disposals (net of Tax) 45 46 47 machine a 48 machine b 49 Total Gain/(Loss) 8,400 (25,000) Tax on G/L (1,848) (5,500) Net Proceeds 408,152 169,500 577,652 H. Calculations 0 1 7 Year 10 11 Revenue on new Product Line 12 COGS: 13 Sales, General & Admin Costs 14 Depreciation (from schedule below) 15 EBIT 16 Taxes 17 Net Income 18 Add Back: Depreciation (from schedule) 19 Less: Erosion Costs (from schedule) 20 Operating Cash Flows 6,520,000 32,600 527,500 1,961,322 3,998,578 879,687 3,118,891 1,961,322 248.316 4,831,896 6,943,800 34,719 521, 170 3,206,082 3,181,829 700,002 2,481,827 3,206,082 264,209 5,423,700 7,395,147 36,976 514,916 2,040,522 4,802,733 1,056,601 3,746,132 2,040,522 281,118 5,505,536 ,875,832 39,379 508,737|| 1,307,746 6,019,969 1,324,393 4,695,576 1,307,746 299, 110 5,704,213 21 Enter all revenues and costs as positive numbers, then account for in 22 Incremental Costs: 23 Capital Spending 24 Start-up Costs 25 After-Tax Proceeds of Disposals 26 Change in Net Working Capital 27 Relevant Opportunity costs: 28 Incremental Cash Flow 1,763,600 585,000 H I J K L 29 30 Discounted Cash Flows: 31 Cumulative Cash Flow: 32 Cumulative Discounted Cash Flow: 33 34 Net Present Value 35 IRR 36 Payback 37 Discounted Payback 38 Profitability Index: 39 40 0 1 2 3 4 41 42 43 Schedule: Revenue Erosion Costs 44 Lost Revenue 45 Related COGS 46 Gross profit 47 Taxes 48 Net Erosion Costs 874,600 556,246 318,354 70,038 248,316 930,574 591,845 338,729 74,520 264,209 990, 131 629,723 360,408 79,290 281,118 1,053,500 670,026 383,474 84,364 299,110 L 1,364,000 597,322 1,961,322 2,182,400 1,023,682 3,206,082 1,309,440 731,082 2,040,522 785,664 522,082 1,307,746 50 Schedule: Depreciation 51 machine 1 (5 year MACRS Life) 52 machine 2 (7 year MACRS Life) 53 Total 54 55 56 57 58 MACRS Tax Tables 5 Year 7 Year 20.00% 14.29% 32.00% 24.49% 19.20% 17.49% 11.52% 12.49% ro 61 WACC Calculation 62 63 Cost of Equity (Ke) 64 65 r* 66 h 67 MRP: 68 Beta: 69 Cost of Equity: 0.95% 1.20% 6.30% 1.3 zo No Cost of Debt (Kd) Weight After-Tax % Weighted YTM 7.2% 6.1% 5.3% | 63 64 65 Description 66 Bond 1 67 Bond 2 68 Bond 3 69 70 71 72 73 74 Cost of Equity (Ke): 75 Cost of Debt (Kd): 76 Par Value 5,000,000 2,500,000 4,850,000 12,350,000 Cost of Debt (Kd): Cost of Capital (Kc) Rate Weight Weighted Balance 15,800,000 12,350,000 28,150,000 WACC
Step by Step Solution
There are 3 Steps involved in it

Get step-by-step solutions from verified subject matter experts