

Question: please show work for problems Forecasting problems Using the following sales figures, first calculate and show the quarterly seasonal indices and deseasonalized sales data, both
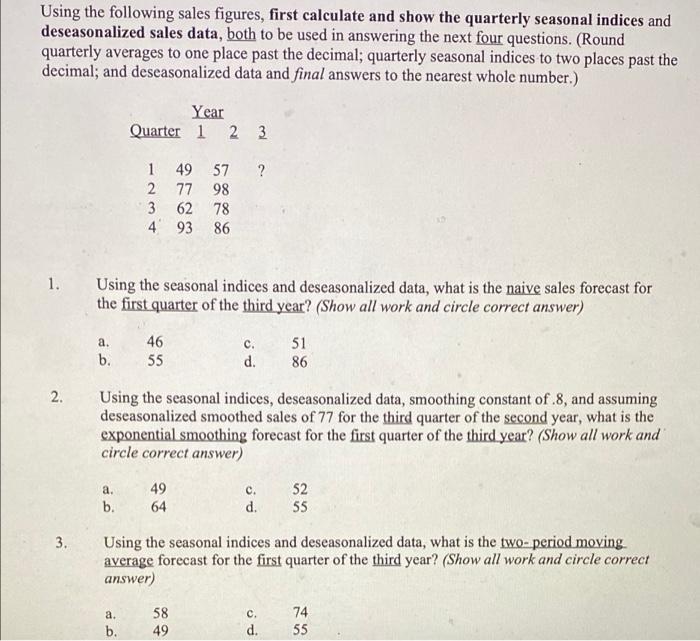
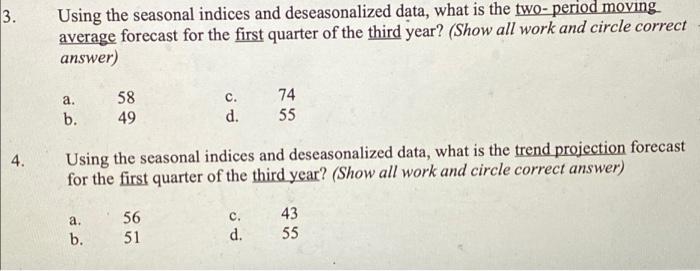
Using the following sales figures, first calculate and show the quarterly seasonal indices and deseasonalized sales data, both to be used in answering the next four questions. (Round quarterly averages to one place past the decimal; quarterly seasonal indices to two places past the decimal; and deseasonalized data and final answers to the nearest whole number.) 1. Using the seasonal indices and deseasonalized data, what is the naive sales forecast for the first quarter of the third year? (Show all work and circle correct answer) a. 46 c.d.5186 b. 55 d. 86 2. Using the seasonal indices, deseasonalized data, smoothing constant of .8, and assuming deseasonalized smoothed sales of 77 for the third quarter of the second year, what is the exponential smoothing forecast for the first quarter of the third year? (Show all work and circle correct answer) a. 49 c.d.5255 b. 64 d. 55 3. Using the seasonal indices and deseasonalized data, what is the two-period moving. average forecast for the first quarter of the third year? (Show all work and circle correct answer) a.b.5849c.d.7455 Using the seasonal indices and deseasonalized data, what is the two-period movingaverage forecast for the first quarter of the third year? (Show all work and circle correct answer) a. 58 c. 74 b. 49 d. 55 Using the seasonal indices and deseasonalized data, what is the trend projection forecast for the first quarter of the third year? (Show all work and circle correct answer) a. 56 c. 43 b. 51 d. 55 Using the following sales figures, first calculate and show the quarterly seasonal indices and deseasonalized sales data, both to be used in answering the next four questions. (Round quarterly averages to one place past the decimal; quarterly seasonal indices to two places past the decimal; and deseasonalized data and final answers to the nearest whole number.) 1. Using the seasonal indices and deseasonalized data, what is the naive sales forecast for the first quarter of the third year? (Show all work and circle correct answer) a. 46 c.d.5186 b. 55 d. 86 2. Using the seasonal indices, deseasonalized data, smoothing constant of .8, and assuming deseasonalized smoothed sales of 77 for the third quarter of the second year, what is the exponential smoothing forecast for the first quarter of the third year? (Show all work and circle correct answer) a. 49 c.d.5255 b. 64 d. 55 3. Using the seasonal indices and deseasonalized data, what is the two-period moving. average forecast for the first quarter of the third year? (Show all work and circle correct answer) a.b.5849c.d.7455 Using the seasonal indices and deseasonalized data, what is the two-period movingaverage forecast for the first quarter of the third year? (Show all work and circle correct answer) a. 58 c. 74 b. 49 d. 55 Using the seasonal indices and deseasonalized data, what is the trend projection forecast for the first quarter of the third year? (Show all work and circle correct answer) a. 56 c. 43 b. 51 d. 55
Step by Step Solution
There are 3 Steps involved in it

Get step-by-step solutions from verified subject matter experts