

Question: Please show work Graphing Linear Equations 3. Graph by creating an x & y table. Then plot the points and graph the line. 2y +
Please show work
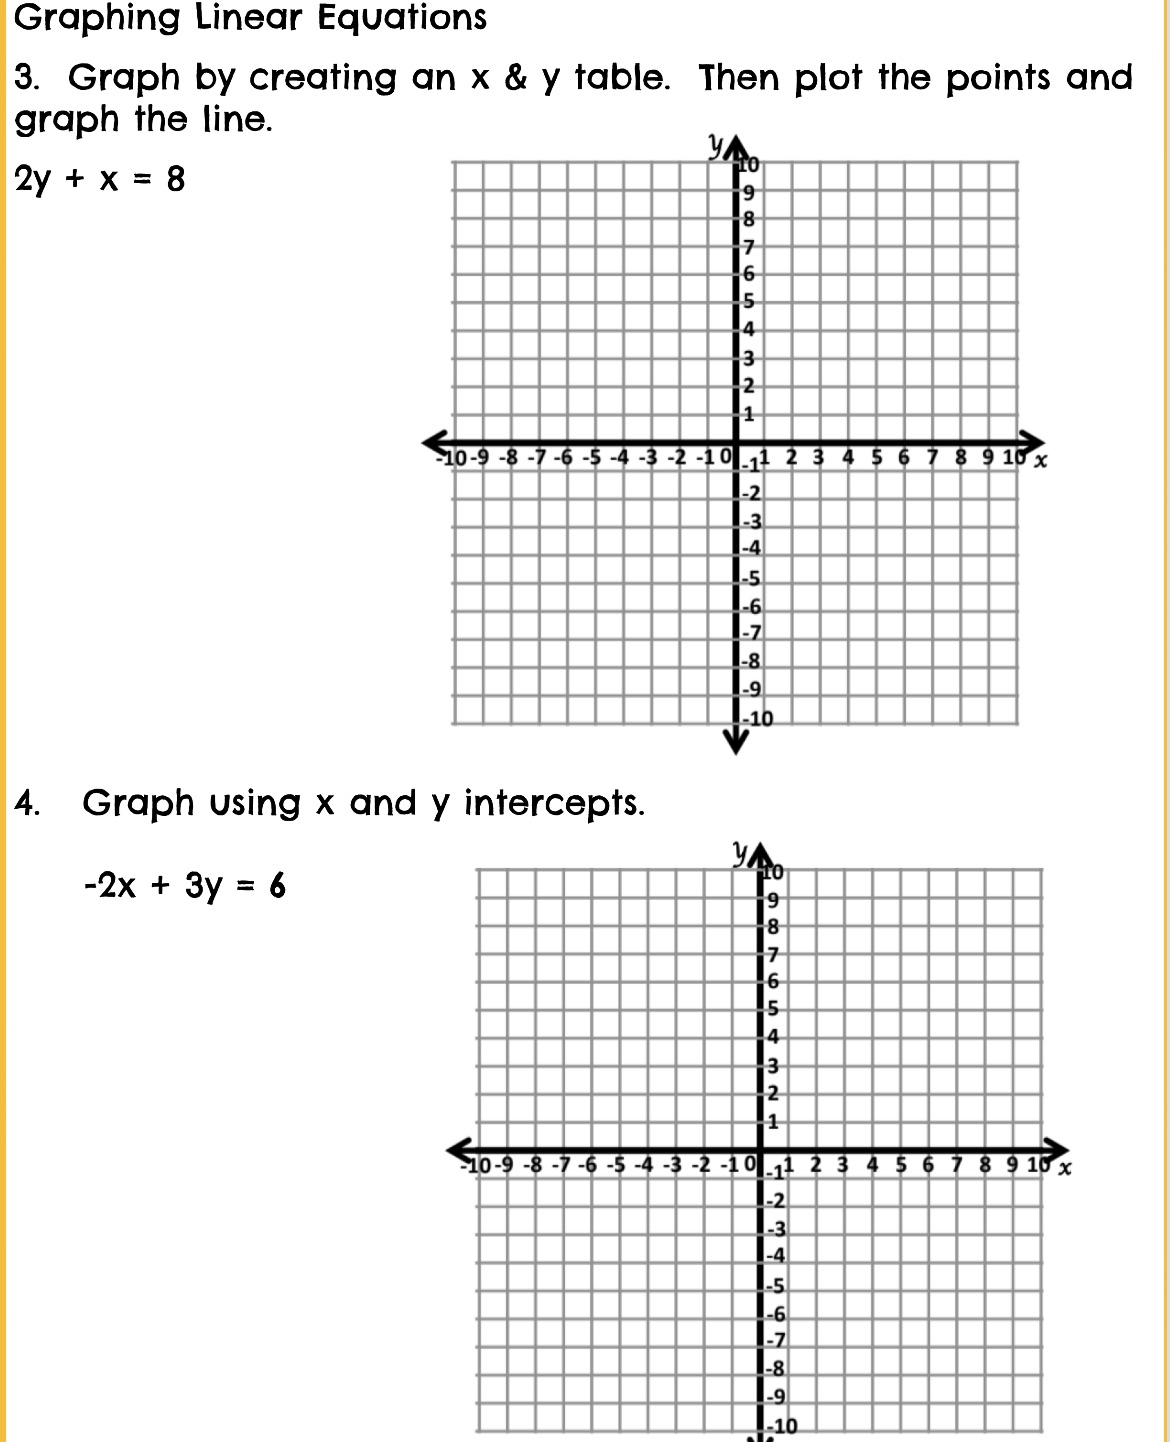
Graphing Linear Equations 3. Graph by creating an x & y table. Then plot the points and graph the line. 2y + X = 8 10-9 -8 -7 -6 -5 -4 -3 -2 -10 1 2 3 4 5 6 7 8 9 10 x 4. Graph using x and y intercepts. -2x + 3y = 6 10-9 -8 -7 -6 -5 -4 -3 -2 -10 _1 2 3 4 5 6 7 8 9 15 x
Step by Step Solution
There are 3 Steps involved in it
1 Expert Approved Answer
Step: 1 Unlock

Question Has Been Solved by an Expert!
Get step-by-step solutions from verified subject matter experts
Step: 2 Unlock
Step: 3 Unlock