Please show work if you can
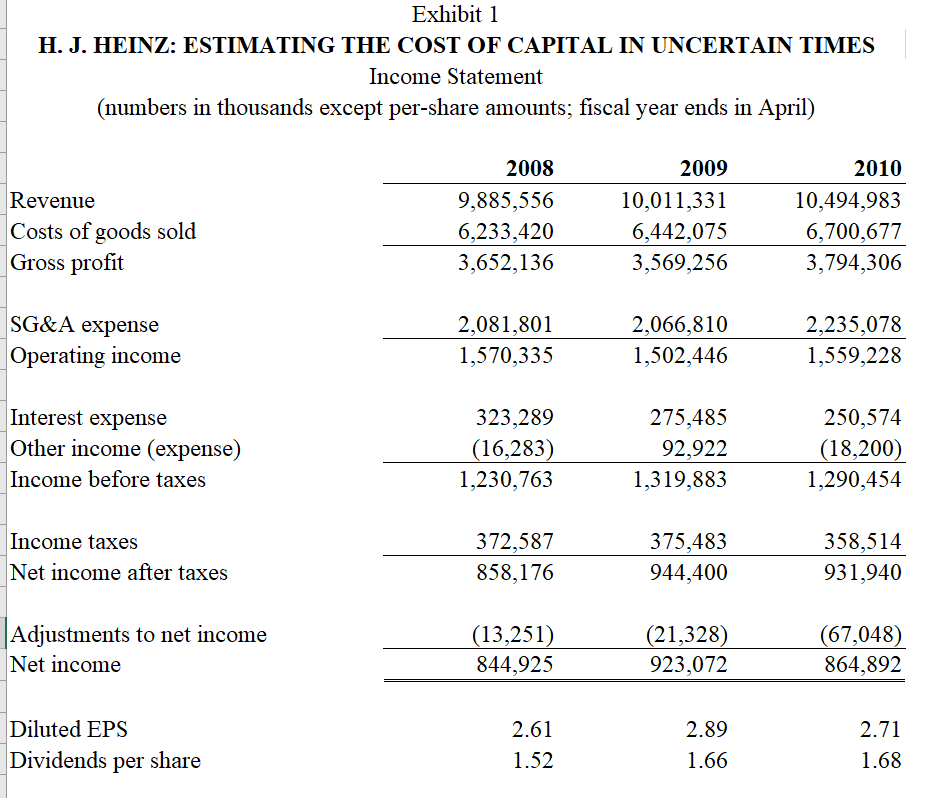
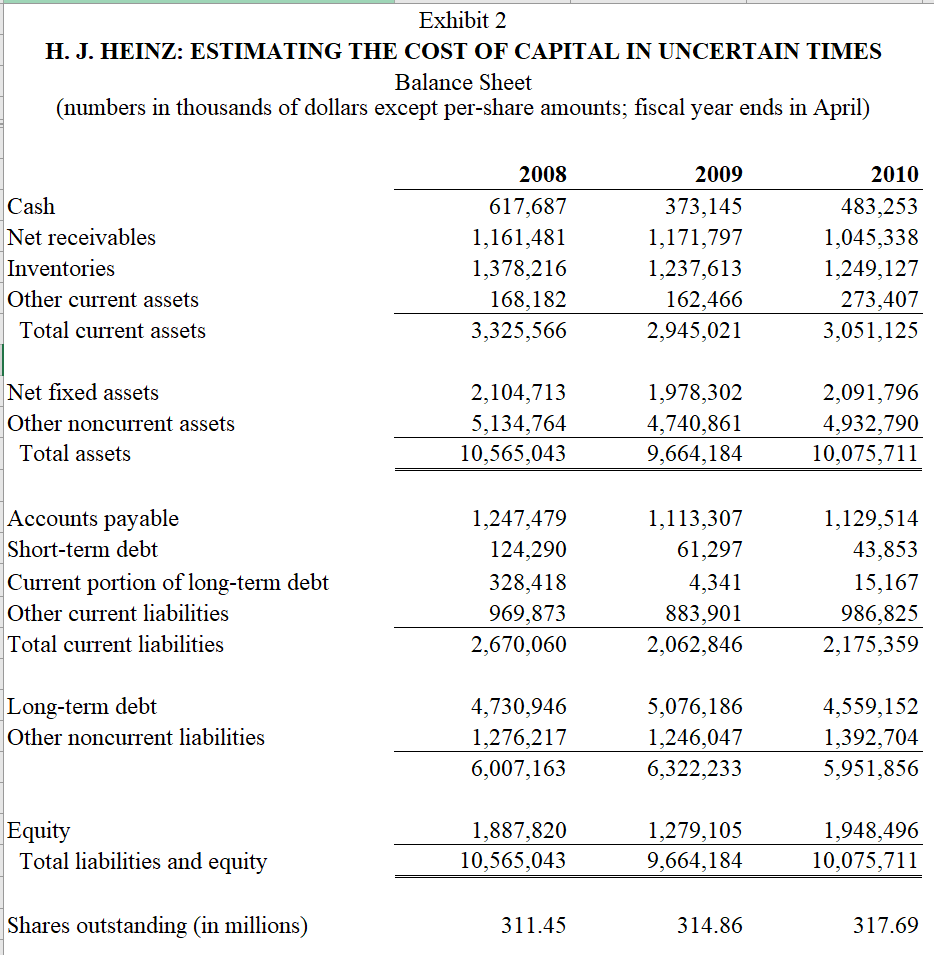
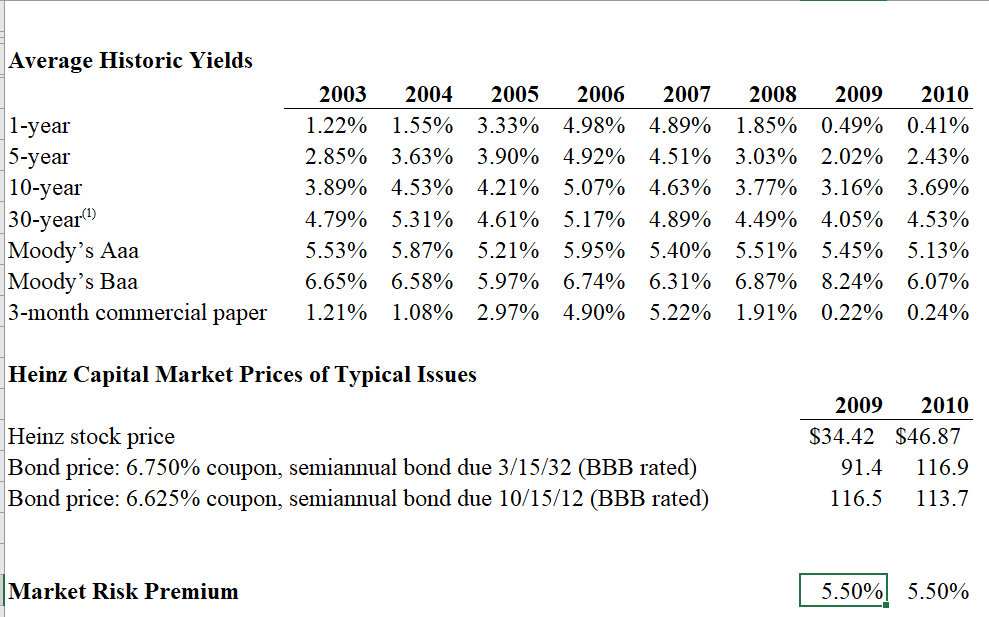
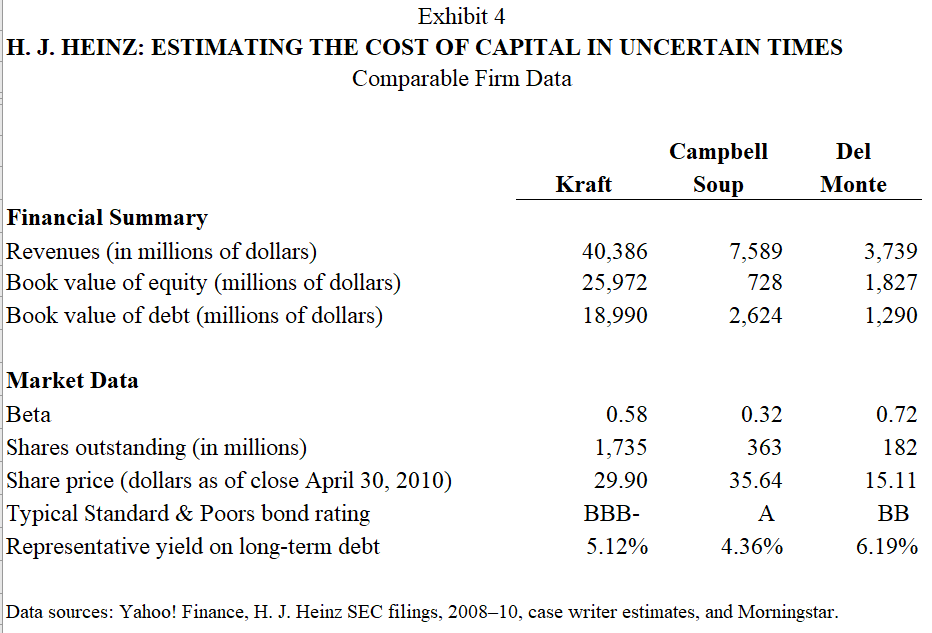
Exhibit 1 H. J. HEINZ: ESTIMATING THE COST OF CAPITAL IN UNCERTAIN TIMES Income Statement (numbers in thousands except per-share amounts; fiscal year ends in April) 2008 2009 2010 Revenue 9,885,556 10,011,331 10,494,983 Costs of goods sold 6,233,420 6,442,075 6,700,677 Gross profit 3,652,136 3,569,256 3,794,306 SG&A expense 2,081,801 2,066,810 2,235,078 Operating income 1,570,335 1,502,446 1,559,228 Interest expense 323,289 275,485 250,574 Other income (expense) (16,283) 92,922 (18,200) Income before taxes 1,230,763 1,319,883 1,290,454 Income taxes 372,587 375,483 358,514 Net income after taxes 858, 176 944,400 931,940 Adjustments to net income (13,251) (21,328) (67,048) Net income 844,925 923,072 864,892 Diluted EPS 2.61 2.89 2.71 Dividends per share 1.52 1.66 1.68Exhibit 2 H. J. HEINZ: ESTIMATING THE COST OF CAPITAL IN UNCERTAIN TIMES Balance Sheet (numbers in thousands of dollars except per-share amounts; fiscal year ends in April) 2008 2009 2010 Cash 617,687 373,145 483,253 Net receivables 1,161,481 1,171,797 1,045,338 Inventories 1,378,216 1,237,613 1,249,127 Other current assets 168, 182 162,466 273,407 Total current assets 3,325,566 2,945,021 3,051,125 Net fixed assets 2,104,713 1,978,302 2,091,796 Other noncurrent assets 5,134,764 4,740,861 4,932,790 Total assets 10,565,043 9,664, 184 10,075,711 Accounts payable 1,247,479 1,113,307 1,129,514 Short-term debt 124,290 61,297 43,853 Current portion of long-term debt 328,418 4,341 15,167 Other current liabilities 969,873 883,901 986,825 Total current liabilities 2,670,060 2,062,846 2, 175,359 Long-term debt 4,730,946 5,076,186 4,559,152 Other noncurrent liabilities 1,276,217 1,246,047 1,392,704 6,007,163 6,322,233 5,951,856 Equity 1,887,820 1,279,105 1,948,496 Total liabilities and equity 10,565,043 9,664, 184 10,075,711 Shares outstanding (in millions) 311.45 314.86 317.69Average Historic Yields 2003 2004 2005 2006 2007 2008 2009 2010 1-year 1.22% 1.55% 3.33% 4.98% 4.89% 1.85% 0.49% 0.41% 5-year 2.85% 3.63% 3.90% 4.92% 4.51% 3.03% 2.02% 2.43% 10-year 3.89% 4.53% 4.21% 5.07% 4.63% 3.77% 3.16% 3.69% 30-year() 4.79% 5.31% 4.61% 5.17% 4.89% 4.49% 4.05% 4.53% Moody's Aaa 5.53% 5.87% 5.21% 5.95% 5.40% 5.51% 5.45% 5.13% Moody's Baa 6.65% 6.58% 5.97% 6.74% 6.31% 6.87% 8.24% 6.07% 3-month commercial paper 1.21% 1.08% 2.97% 4.90% 5.22% 1.91% 0.22% 0.24% Heinz Capital Market Prices of Typical Issues 2009 2010 Heinz stock price $34.42 $46.87 Bond price: 6.750% coupon, semiannual bond due 3/15/32 (BBB rated) 91.4 116.9 Bond price: 6.625% coupon, semiannual bond due 10/15/12 (BBB rated) 116.5 113.7 Market Risk Premium 5.50% 5.50%\f1. What is the rm's cost of debt capital as of the end of April 2010? One year earlier (April 2009)? 2. What is beta and cost of equity capital for Heinz?3. What capital structure weights should be used in the WACC calculation