

Question: Please show work in excel with formulas/results. thank you! Using a four-year moving average, compute MSE and a forecast for the year 11, for the
Please show work in excel with formulas/results. thank you! 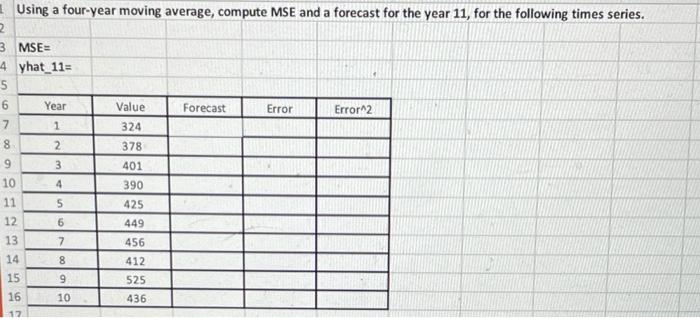
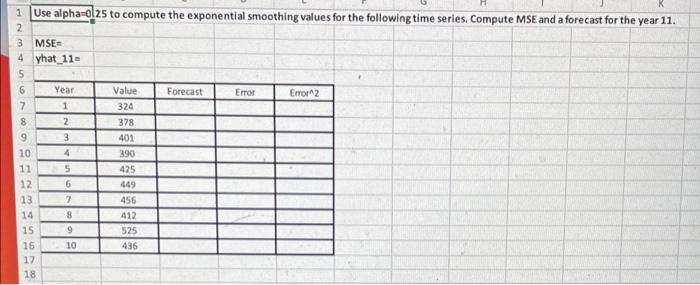
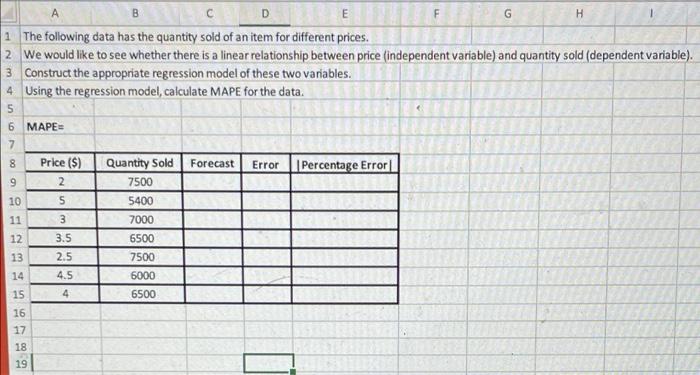
Using a four-year moving average, compute MSE and a forecast for the year 11, for the following times series. 2 3 MSE 4 yhat_11= 5 6 Year Value Forecast Error Error2 7 1 324 8 2 378 9 3 401 10 4 390 11 5 425 12 6 449 13 7 456 14 8 412 15 9 525 16 10 436 17 NO 1 Use alphawol 25 to compute the exponential smoothing values for the following time series. Compute MSE and a forecast for the year 11. 2 3 MSE 4 yhat_11 5 6 Year Value Forecast Error Error2 7 1 324 8 2 378 9 3 401 10 4 390 11 5 425 12 6 449 13 7 456 14 8 412 15 9 525 16 10 17 18 436 E H D G 1 The following data has the quantity sold of an item for different prices. 2. We would like to see whether there is a linear relationship between price (independent variable) and quantity sold (dependent variable). 3 Construct the appropriate regression model of these two variables. 4 Using the regression model, calculate MAPE for the data. 5 6 MAPE= 7 8 Price ($) Quantity Sold Forecast Percentage Error 7500 5 7000 6500 7500 Error 9 2 10 5400 11 3 12 3.5 13 2.5 14 6000 4.5 4 15 6500 16 17 18 19
Step by Step Solution
There are 3 Steps involved in it
1 Expert Approved Answer
Step: 1 Unlock

Question Has Been Solved by an Expert!
Get step-by-step solutions from verified subject matter experts
Step: 2 Unlock
Step: 3 Unlock