

Question: PLEASE SHOW WORK ON EXCEL 3. A farmer brought a truck load of apples. You as a quality manager, picked a sample of 100 apples
PLEASE SHOW WORK ON EXCEL
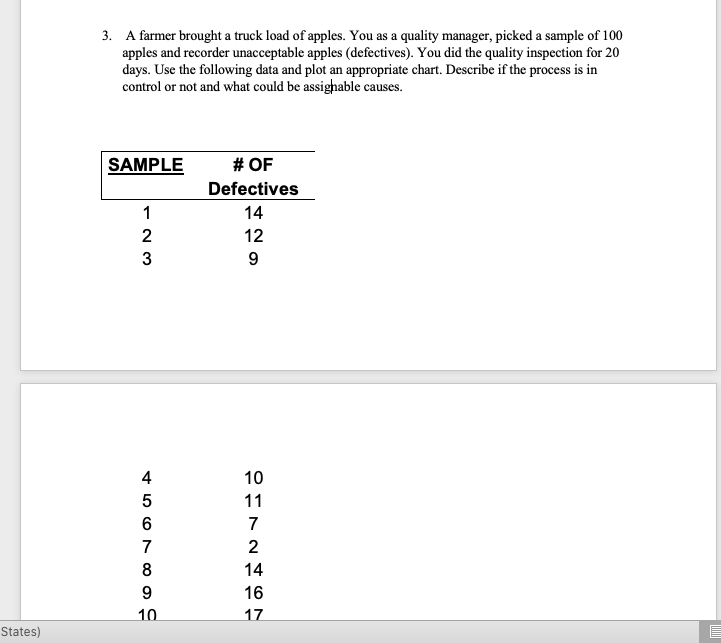
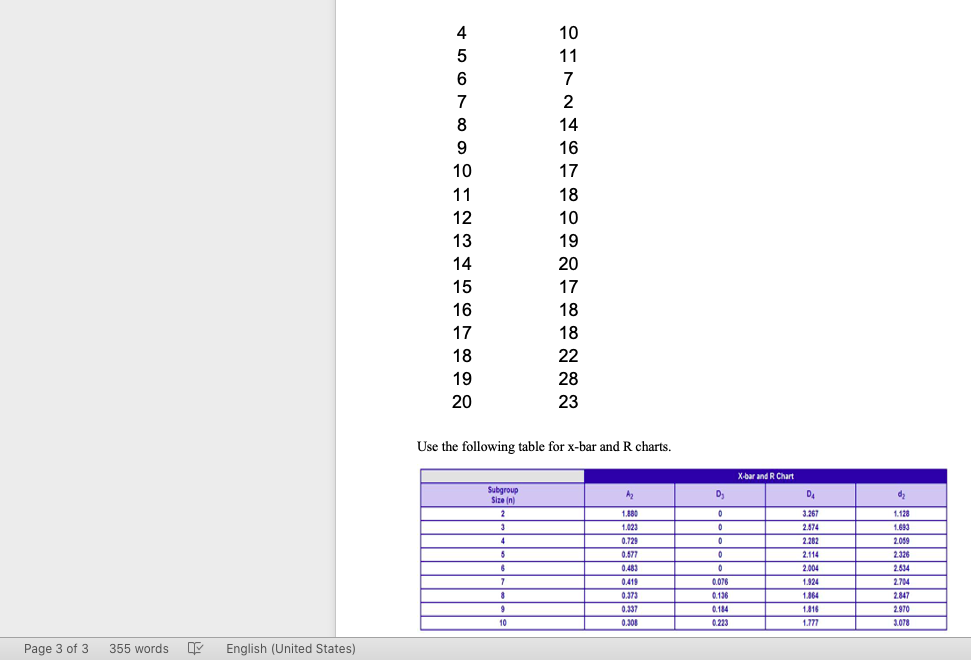
3. A farmer brought a truck load of apples. You as a quality manager, picked a sample of 100 apples and recorder unacceptable apples (defectives). You did the quality inspection for 20 days. Use the following data and plot an appropriate chart. Describe if the process is in control or not and what could be assighable causes. SAMPLE 1 # OF Defectives 14 12 9 WN 10 11 4 5 6 7 8 9 10 217246 17 States) +00 172 14 16 17 9 10 11 12 13 14 15 16 17 18 19 20 18 10 19 20 17 18 Use the following table for x-bar and R charts. X-bar and R Chart Page 3 of 3 355 words of English (United States)Step by Step Solution
There are 3 Steps involved in it
1 Expert Approved Answer
Step: 1 Unlock

Question Has Been Solved by an Expert!
Get step-by-step solutions from verified subject matter experts
Step: 2 Unlock
Step: 3 Unlock