

Question: Please show work Question 2 (8 marks) The following data are quarterly sales of engine oil (in thousands of gallons) in the Montreal region. Year
Please show work 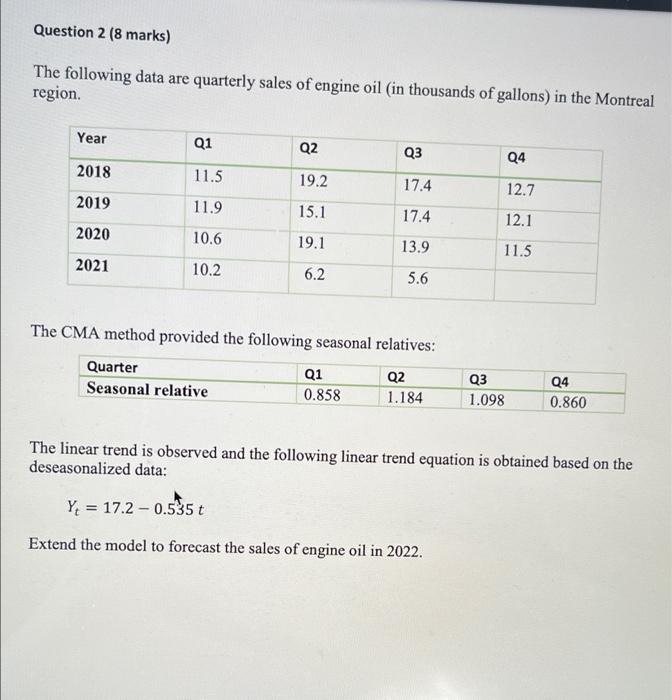
Question 2 (8 marks) The following data are quarterly sales of engine oil (in thousands of gallons) in the Montreal region. Year Q1 Q2 Q3 Q4 2018 11.5 19.2 17.4 12.7 2019 11.9 15.1 17.4 12.1 2020 10.6 19.1 13.9 11.5 2021 10.2 6.2 5.6 The CMA method provided the following seasonal relatives: Quarter Q1 Q2 Seasonal relative 0.858 1.184 Q3 1.098 Q4 0.860 The linear trend is observed and the following linear trend equation is obtained based on the deseasonalized data: Y = 17.2 0.535 t Extend the model to forecast the sales of engine oil in 2022
Step by Step Solution
There are 3 Steps involved in it
1 Expert Approved Answer
Step: 1 Unlock

Question Has Been Solved by an Expert!
Get step-by-step solutions from verified subject matter experts
Step: 2 Unlock
Step: 3 Unlock