

Question: please show work! Question 3 Now, using the same graph, let's look at the effect of food addition (a density-dependent effect) on weaning rate in
please show work!
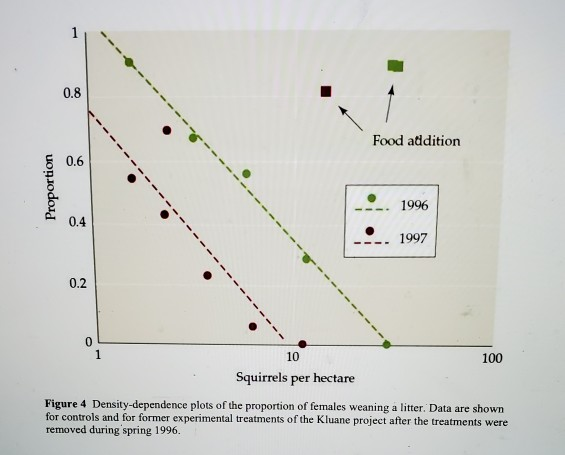
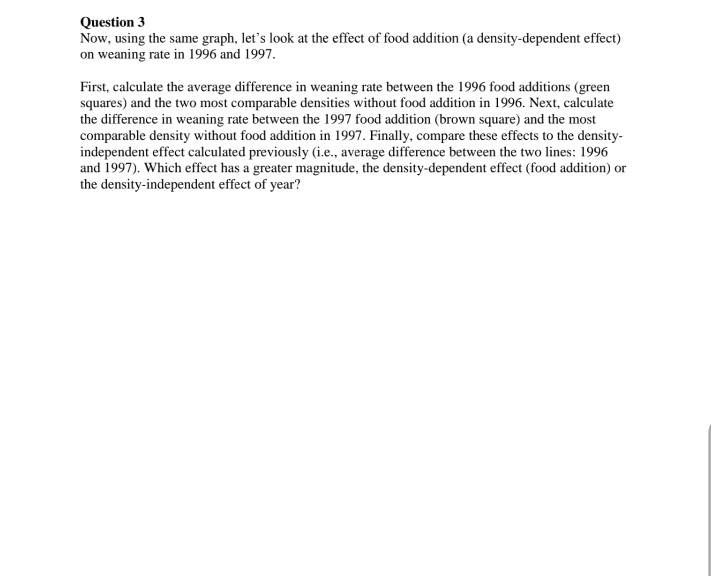
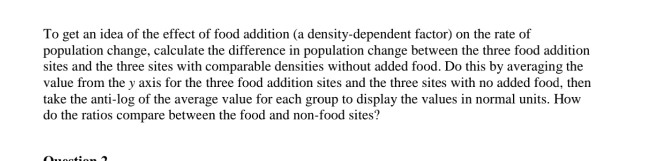
Question 3 Now, using the same graph, let's look at the effect of food addition (a density-dependent effect) on weaning rate in 1996 and 1997. First, calculate the average difference in weaning rate between the 1996 food additions (green squares) and the two most comparable densities without food addition in 1996. Next, calculate the difference in weaning rate between the 1997 food addition (brown square) and the most comparable density without food addition in 1997. Finally, compare these effects to the density- independent effect calculated previously (i.e., average difference between the two lines: 1996 and 1997). Which effect has a greater magnitude, the density-dependent effect (food addition) or the density-independent effect of year? To get an idea of the effect of food addition (a density-dependent factor) on the rate of population change, calculate the difference in population change between the three food addition sites and the three sites with comparable densities without added food. Do this by averaging the value from the y axis for the three food addition sites and the three sites with no added food, then take the anti-log of the average value for each group to display the values in normal units. How do the ratios compare between the food and non-food sites? antis Food addition Proportion -- 1996 1997 Squirrels per hectare Figure 4 Density-dependence plots of the proportion of females weaning a litter. Data are shown for controls and for former experimental treatments of the Kluane project after the treatments were removed during spring 1996. Question 3 Now, using the same graph, let's look at the effect of food addition (a density-dependent effect) on weaning rate in 1996 and 1997. First, calculate the average difference in weaning rate between the 1996 food additions (green squares) and the two most comparable densities without food addition in 1996. Next, calculate the difference in weaning rate between the 1997 food addition (brown square) and the most comparable density without food addition in 1997. Finally, compare these effects to the density- independent effect calculated previously (i.e., average difference between the two lines: 1996 and 1997). Which effect has a greater magnitude, the density-dependent effect (food addition) or the density-independent effect of year? To get an idea of the effect of food addition (a density-dependent factor) on the rate of population change, calculate the difference in population change between the three food addition sites and the three sites with comparable densities without added food. Do this by averaging the value from the y axis for the three food addition sites and the three sites with no added food, then take the anti-log of the average value for each group to display the values in normal units. How do the ratios compare between the food and non-food sites? antis Food addition Proportion -- 1996 1997 Squirrels per hectare Figure 4 Density-dependence plots of the proportion of females weaning a litter. Data are shown for controls and for former experimental treatments of the Kluane project after the treatments were removed during spring 1996
Step by Step Solution
There are 3 Steps involved in it

Get step-by-step solutions from verified subject matter experts