

Question: Please show work thoroughly using excel. Please show all excel formulas to find the beta 5 years, beta first 2 years, and beta last 2
Please show work thoroughly using excel. Please show all excel formulas to find the beta 5 years, beta first 2 years, and beta last 2 years for Ford, GM, and Toyota.
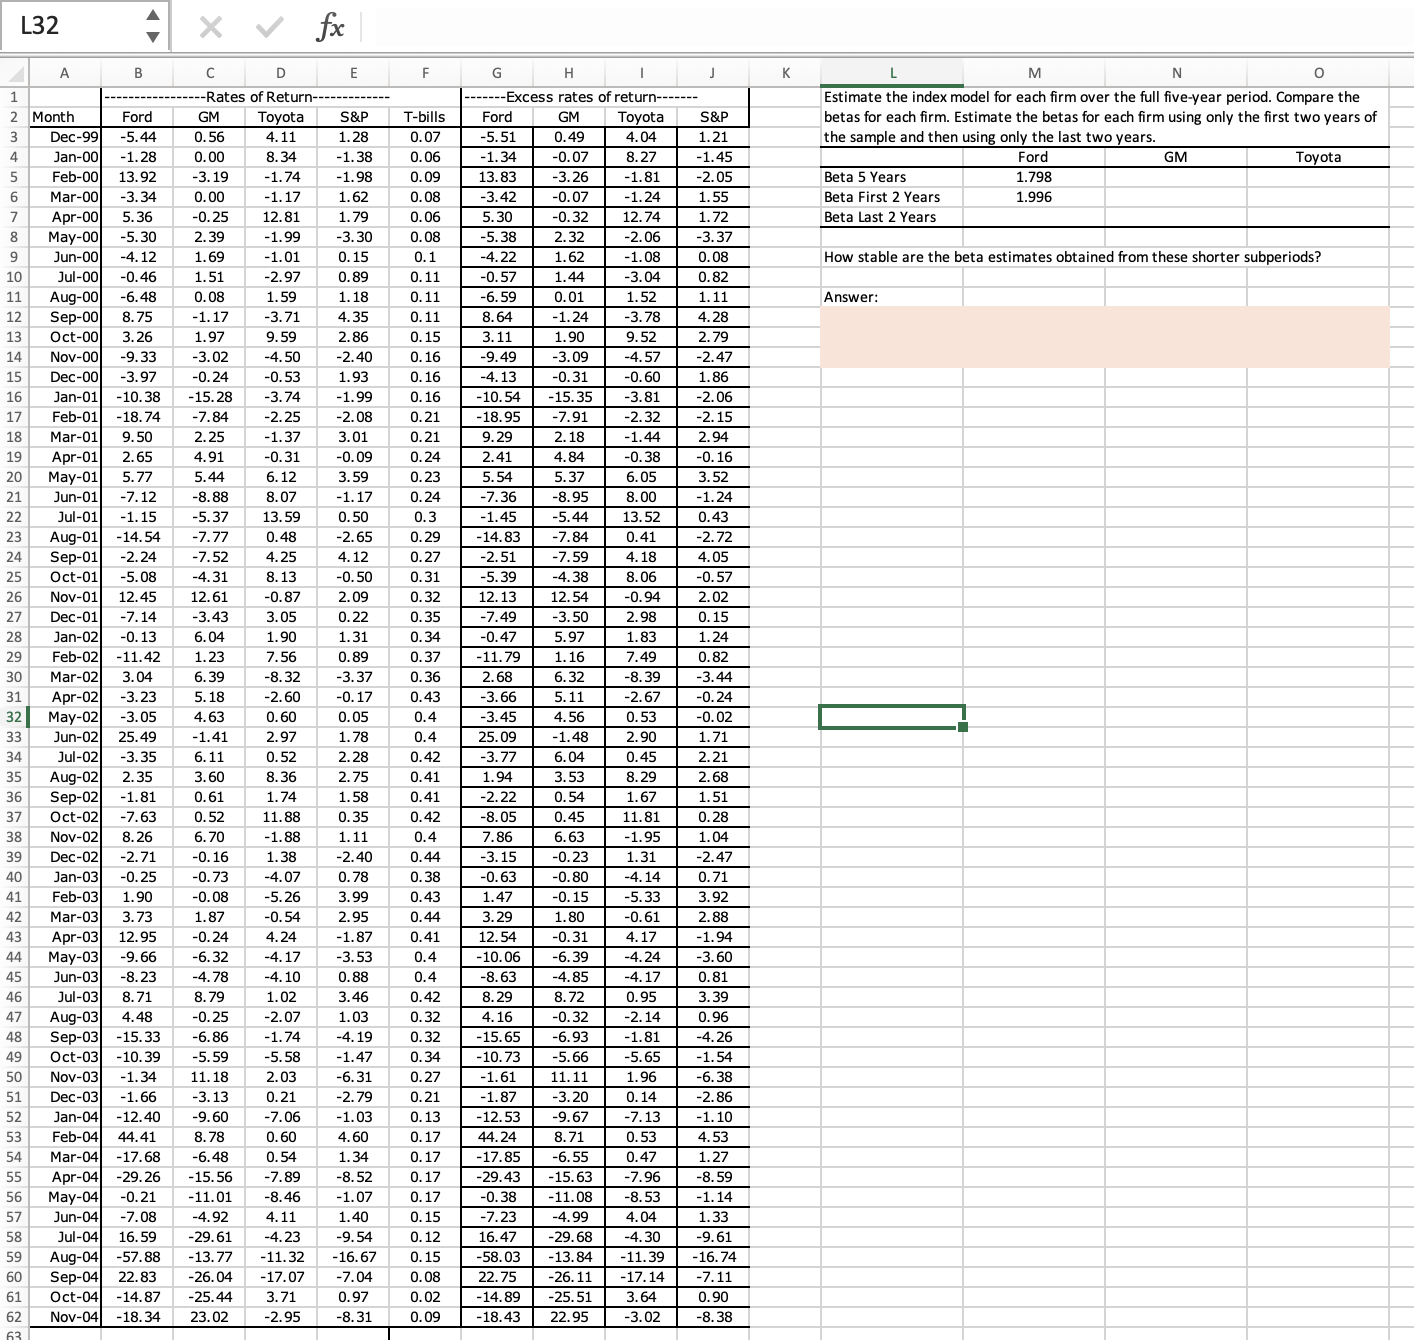
L32 f A B E F. F G T-bills 0.07 0.06 0.09 0.08 M N 0 Estimate the index model for each firm over the full five-year period. Compare the betas for each firm. Estimate the betas for each firm using only the first two years of the sample and then using only the last two years. Ford GM Toyota Beta 5 Years 1.798 Beta First 2 Years 1.996 Beta Last 2 Years 0.06 1.62 How stable are the beta estimates obtained from these shorter subperiods? 1.59 0.08 0.1 0.11 0.11 0.11 0.15 0.16 0.01 Answer: 2.79 0.16 0.16 0.21 0.21 -0.31 0.24 0.23 0.43 D -Rates of Return- GM Toyota 0.56 4.11 0.00 8.34 -3.19 -1.74 0.00 -1.17 -0.25 12.81 2.39 -1.99 1.69 -1.01 1.51 -2.97 0.08 -1.17 -3.71 1.97 9.59 -3.02 -4.50 -0.24 -0.53 -15.28 -3.74 -7.84 -2.25 2.25 -1.37 4.91 5.44 6.12 -8.88 8.07 -5.37 13.59 -7.77 0.48 -7.52 4.25 -4.31 8.13 12.61 -0.87 -3.43 3.05 6.04 1.90 1.23 7.56 6.39 -8.32 5.18 -2.60 4.63 0.60 -1.41 2.97 6.11 3.60 8.36 0.61 1.74 0.52 11.88 -1.88 -0.16 1.38 -0.73 -4.07 -0.08 -5.26 1.87 -0.54 -0.24 -6.32 -4.17 -4.78 -4.10 8.79 1.02 -0.25 -6.86 -1.74 -5.59 -5.58 11.18 2.03 -3.13 0.21 -9.60 -7.06 -0.94 1 2 Month Ford 3 Dec-99 -5.44 4 Jan-001 -1.28 5 Feb-00 13.92 6 Mar-00 -3.34 7 Apr-00 5.36 8 May-00 -5.30 9 Jun-001 -4.12 10 Jul-00 -0.46 11 Aug-00 -6.48 12 Sep-00 8.75 13 Oct-001 3.26 14 Nov-00 -9.33 15 Dec-00 -3.97 16 Jan-01 -10.38 17 Feb-01 - 18.74 18 Mar-01 9.50 19 Apr-01 2.65 20 May-01 5.77 21 Jun-01 -7.12 22 Jul-01 -1.15 23 Aug-01 -14.54 24 Sep-01 -2.24 25 Oct-01 -5.08 26 Nov-01 12.45 27 Dec-01 -7.14 28 Jan-02 -0.13 29 Feb-02 -11.42 30 Mar-02 3.04 31 Apr-021 -3.23 32 May-02 -3.05 33 Jun-02 25.49 34 Jul-02 -3.35 35 Aug-02 2.35 36 Sep-02 -1.81 37 Oct-02 -7.63 38 Nov-02 39 Dec-021 -2.71 40 Jan-03 -0.25 41 Feb-03 42 Mar-03 3.73 43 Apr-03 12.95 44 May-03) -9.66 45 Jun-03 -8.23 46 Jul-03 8.71 47 Aug-03 4.48 48 Sep-031 -15.33 49 Oct-03 -10.39 50 Nov-03 -1.34 51 Dec-03 -1.66 52 Jan-04 -12.40 53 Feb-04 44.41 54 Mar-04 -17.68 55 Apr-04 -29.26 56 May-04 -0.21 57 Jun-04 -7.08 58 Jul-04 16.59 59 Aug-04 -57.88 60 Sep-041 22.83 61 Oct-04 -14.87 62 Nov-04 -18.34 63 1.24 S&P 1.28 -1.38 -1.98 1.62 1.79 -3.30 0.15 0.89 1.18 4.35 2.86 -2.40 1.93 -1.99 -2.08 3.01 -0.09 3.59 -1.17 0.50 -2.65 4.12 -0.50 2.09 0.22 1.31 0.89 -3.37 -0.17 0.05 1.78 2.28 2.75 1.58 0.35 1.11 -2.40 0.78 3.99 2.95 -1.87 -3.53 0.88 3.46 1.03 -4.19 -1.47 -6.31 -2.79 -1.03 4.60 1.34 -8.52 -1.07 1.40 -9.54 - 16.67 -7.04 0.97 -8.31 G H 1 J -------Excess rates of return------- Ford GM Toyota S&P -5.51 0.49 4.04 1.21 -1.34 -0.07 8.27 -1.45 13.83 -3.26 -1.81 -2.05 -3.42 -0.07 -1.24 1.55 5.30 -0.32 12.74 1.72 -5.38 2.32 -2.06 -3.37 -4.22 -1.08 0.08 -0.57 1.44 -3.04 0.82 -6.59 1.52 1.11 8.64 -1.24 -3.78 4.28 3.11 1.90 9.52 -9.49 -3.09 -4.57 -2.47 -4.13 -0.31 -0.60 1.86 -10.54 -15.35 -3.81 -2.06 -18.95 -7.91 -2.32 -2.15 9.29 2.18 -1.44 2.94 2.41 4.84 -0.38 -0.16 5.54 5.37 6.05 3.52 -7.36 -8.95 8.00 -1.24 -1.45 -5.44 13.52 -14.83 -7.84 0.41 -2.72 -2.51 -7.59 4.18 4.05 -5.39 -4.38 8.06 -0.57 12.13 12.54 2.02 -7.49 -3.50 2.98 0.15 -0.47 5.97 1.83 -11.79 1.16 7.49 0.82 2.68 6.32 -8.39 -3.44 -3.66 5.11 -2.67 -0.24 4.56 0.53 25.09 -1.48 2.90 1.71 6.04 0.45 2.21 1.94 3.53 8.29 2.68 -2.22 0.54 1.67 1.51 -8.05 0.45 11.81 0.28 7.86 6.63 -1.95 1.04 -3.15 -0.23 1.31 -2.47 -0.63 -0.80 -4.14 0.71 1.47 -0.15 -5.33 3.92 3.29 1.80 -0.61 2.88 12.54 -0.31 4.17 -1.94 -10.06 -6.39 -4.24 -3.60 -8.63 -4.85 0.81 8.29 8.72 0.95 3.39 4.16 -0.32 -2.14 0.96 - 15.65 -6.93 -1.81 -4.26 -10.73 -5.66 -5.65 -1.54 -1.61 11.11 1.96 -6.38 -1.87 -3.20 0.14 -2.86 -12.53 -9.67 -7.13 -1.10 44.24 8.71 0.53 4.53 -17.85 -6.55 0.47 1.27 -29.43 - 15.63 -7.96 -0.38 -11.08 -8.53 -1.14 -7.23 -4.99 4.04 1.33 16.47 -29.68 -4.30 -9.61 -58.03 -13.84 -11.39 -16.74 22.75 -26.11 -17.14 -7.11 -14.89 -25.51 3.64 0.90 -18.43 22.95 -3.02 -8.38 -3.45 0.24 0.3 0.29 0.27 0.31 0.32 0.35 0.34 0.37 0.36 0.43 0.4 0.4 0.42 0.41 0.41 0.42 0.4 0.44 0.38 0.43 0.44 0.41 0.4 0.4 0.42 -0.02 0.52 -3.77 8.26 6.70 1.90 4.24 -4.17 -2.07 0.32 0.32 0.34 0.27 0.21 0.13 8.78 0.60 0.17 -8.59 -6.48 -15.56 -11.01 -4.92 -29.61 -13.77 -26.04 -25.44 23.02 0.54 -7.89 -8.46 4.11 -4.23 -11.32 -17.07 3.71 -2.95 0.17 0.17 0.17 0.15 0.12 0.15 0.08 0.02 0.09 L32 f A B E F. F G T-bills 0.07 0.06 0.09 0.08 M N 0 Estimate the index model for each firm over the full five-year period. Compare the betas for each firm. Estimate the betas for each firm using only the first two years of the sample and then using only the last two years. Ford GM Toyota Beta 5 Years 1.798 Beta First 2 Years 1.996 Beta Last 2 Years 0.06 1.62 How stable are the beta estimates obtained from these shorter subperiods? 1.59 0.08 0.1 0.11 0.11 0.11 0.15 0.16 0.01 Answer: 2.79 0.16 0.16 0.21 0.21 -0.31 0.24 0.23 0.43 D -Rates of Return- GM Toyota 0.56 4.11 0.00 8.34 -3.19 -1.74 0.00 -1.17 -0.25 12.81 2.39 -1.99 1.69 -1.01 1.51 -2.97 0.08 -1.17 -3.71 1.97 9.59 -3.02 -4.50 -0.24 -0.53 -15.28 -3.74 -7.84 -2.25 2.25 -1.37 4.91 5.44 6.12 -8.88 8.07 -5.37 13.59 -7.77 0.48 -7.52 4.25 -4.31 8.13 12.61 -0.87 -3.43 3.05 6.04 1.90 1.23 7.56 6.39 -8.32 5.18 -2.60 4.63 0.60 -1.41 2.97 6.11 3.60 8.36 0.61 1.74 0.52 11.88 -1.88 -0.16 1.38 -0.73 -4.07 -0.08 -5.26 1.87 -0.54 -0.24 -6.32 -4.17 -4.78 -4.10 8.79 1.02 -0.25 -6.86 -1.74 -5.59 -5.58 11.18 2.03 -3.13 0.21 -9.60 -7.06 -0.94 1 2 Month Ford 3 Dec-99 -5.44 4 Jan-001 -1.28 5 Feb-00 13.92 6 Mar-00 -3.34 7 Apr-00 5.36 8 May-00 -5.30 9 Jun-001 -4.12 10 Jul-00 -0.46 11 Aug-00 -6.48 12 Sep-00 8.75 13 Oct-001 3.26 14 Nov-00 -9.33 15 Dec-00 -3.97 16 Jan-01 -10.38 17 Feb-01 - 18.74 18 Mar-01 9.50 19 Apr-01 2.65 20 May-01 5.77 21 Jun-01 -7.12 22 Jul-01 -1.15 23 Aug-01 -14.54 24 Sep-01 -2.24 25 Oct-01 -5.08 26 Nov-01 12.45 27 Dec-01 -7.14 28 Jan-02 -0.13 29 Feb-02 -11.42 30 Mar-02 3.04 31 Apr-021 -3.23 32 May-02 -3.05 33 Jun-02 25.49 34 Jul-02 -3.35 35 Aug-02 2.35 36 Sep-02 -1.81 37 Oct-02 -7.63 38 Nov-02 39 Dec-021 -2.71 40 Jan-03 -0.25 41 Feb-03 42 Mar-03 3.73 43 Apr-03 12.95 44 May-03) -9.66 45 Jun-03 -8.23 46 Jul-03 8.71 47 Aug-03 4.48 48 Sep-031 -15.33 49 Oct-03 -10.39 50 Nov-03 -1.34 51 Dec-03 -1.66 52 Jan-04 -12.40 53 Feb-04 44.41 54 Mar-04 -17.68 55 Apr-04 -29.26 56 May-04 -0.21 57 Jun-04 -7.08 58 Jul-04 16.59 59 Aug-04 -57.88 60 Sep-041 22.83 61 Oct-04 -14.87 62 Nov-04 -18.34 63 1.24 S&P 1.28 -1.38 -1.98 1.62 1.79 -3.30 0.15 0.89 1.18 4.35 2.86 -2.40 1.93 -1.99 -2.08 3.01 -0.09 3.59 -1.17 0.50 -2.65 4.12 -0.50 2.09 0.22 1.31 0.89 -3.37 -0.17 0.05 1.78 2.28 2.75 1.58 0.35 1.11 -2.40 0.78 3.99 2.95 -1.87 -3.53 0.88 3.46 1.03 -4.19 -1.47 -6.31 -2.79 -1.03 4.60 1.34 -8.52 -1.07 1.40 -9.54 - 16.67 -7.04 0.97 -8.31 G H 1 J -------Excess rates of return------- Ford GM Toyota S&P -5.51 0.49 4.04 1.21 -1.34 -0.07 8.27 -1.45 13.83 -3.26 -1.81 -2.05 -3.42 -0.07 -1.24 1.55 5.30 -0.32 12.74 1.72 -5.38 2.32 -2.06 -3.37 -4.22 -1.08 0.08 -0.57 1.44 -3.04 0.82 -6.59 1.52 1.11 8.64 -1.24 -3.78 4.28 3.11 1.90 9.52 -9.49 -3.09 -4.57 -2.47 -4.13 -0.31 -0.60 1.86 -10.54 -15.35 -3.81 -2.06 -18.95 -7.91 -2.32 -2.15 9.29 2.18 -1.44 2.94 2.41 4.84 -0.38 -0.16 5.54 5.37 6.05 3.52 -7.36 -8.95 8.00 -1.24 -1.45 -5.44 13.52 -14.83 -7.84 0.41 -2.72 -2.51 -7.59 4.18 4.05 -5.39 -4.38 8.06 -0.57 12.13 12.54 2.02 -7.49 -3.50 2.98 0.15 -0.47 5.97 1.83 -11.79 1.16 7.49 0.82 2.68 6.32 -8.39 -3.44 -3.66 5.11 -2.67 -0.24 4.56 0.53 25.09 -1.48 2.90 1.71 6.04 0.45 2.21 1.94 3.53 8.29 2.68 -2.22 0.54 1.67 1.51 -8.05 0.45 11.81 0.28 7.86 6.63 -1.95 1.04 -3.15 -0.23 1.31 -2.47 -0.63 -0.80 -4.14 0.71 1.47 -0.15 -5.33 3.92 3.29 1.80 -0.61 2.88 12.54 -0.31 4.17 -1.94 -10.06 -6.39 -4.24 -3.60 -8.63 -4.85 0.81 8.29 8.72 0.95 3.39 4.16 -0.32 -2.14 0.96 - 15.65 -6.93 -1.81 -4.26 -10.73 -5.66 -5.65 -1.54 -1.61 11.11 1.96 -6.38 -1.87 -3.20 0.14 -2.86 -12.53 -9.67 -7.13 -1.10 44.24 8.71 0.53 4.53 -17.85 -6.55 0.47 1.27 -29.43 - 15.63 -7.96 -0.38 -11.08 -8.53 -1.14 -7.23 -4.99 4.04 1.33 16.47 -29.68 -4.30 -9.61 -58.03 -13.84 -11.39 -16.74 22.75 -26.11 -17.14 -7.11 -14.89 -25.51 3.64 0.90 -18.43 22.95 -3.02 -8.38 -3.45 0.24 0.3 0.29 0.27 0.31 0.32 0.35 0.34 0.37 0.36 0.43 0.4 0.4 0.42 0.41 0.41 0.42 0.4 0.44 0.38 0.43 0.44 0.41 0.4 0.4 0.42 -0.02 0.52 -3.77 8.26 6.70 1.90 4.24 -4.17 -2.07 0.32 0.32 0.34 0.27 0.21 0.13 8.78 0.60 0.17 -8.59 -6.48 -15.56 -11.01 -4.92 -29.61 -13.77 -26.04 -25.44 23.02 0.54 -7.89 -8.46 4.11 -4.23 -11.32 -17.07 3.71 -2.95 0.17 0.17 0.17 0.15 0.12 0.15 0.08 0.02 0.09
Step by Step Solution
There are 3 Steps involved in it

Get step-by-step solutions from verified subject matter experts