

Question: Please show working Here is the monthly stock price data for Ford Corp. and GM Corp. 1 2 3 4 5 6 7 8 9
Please show working
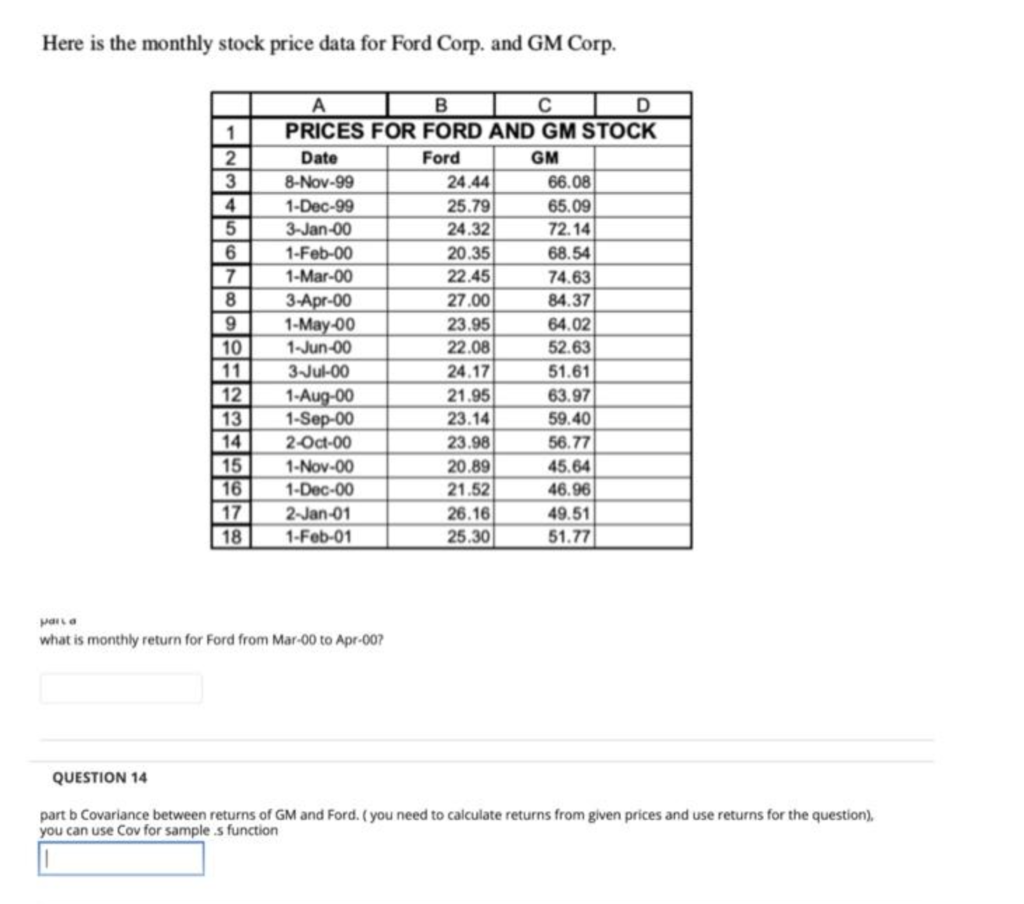
Here is the monthly stock price data for Ford Corp. and GM Corp. 1 2 3 4 5 6 7 8 9 10 11 12 13 14 15 16 17 18 B I CID PRICES FOR FORD AND GM STOCK Date Ford GM 8-Nov-99 24.44 66.08 1-Dec-99 25.79 65.09 3-Jan-00 24.32 72.14 1-Feb-00 20.35 68.54 1-Mar-00 22.45 74.63 3-Apr-00 27.00 84.37 1-May-00 23.95 64.02 1-Jun-00 22.08 52.63 3-Jul-00 24.17 51.61 1-Aug-00 21.95 63.97 1-Sep-00 23.14 59.40 2-Oct-00 23.98 56.77 1-Nov-00 20.89 45.64 1-Dec-00 21.52 46.96 2-Jan-01 26.16 49.51 1-Feb-01 25.30 51.77 what is monthly return for Ford from Mar-00 to Apr-00? QUESTION 14 part b Covariance between returns of GM and Ford. (you need to calculate returns from given prices and use returns for the question), you can use Cov for samples function 4. Using the returns of Ford and GM corporations you calculated in the previous question, perform a regression of Ford's returns versus GM's returns. Report the following: The slope of the regression. The value of the intercept. The r-squared of the regression. part a the slope of the regression Ford is Y and GM is X, please pay attention questions need to use returns, the above information is for prices. You need to calculate returns first and run regression) QUESTION 16 part b the value of intercept QUESTION 17 part c R square of the regression
Step by Step Solution
There are 3 Steps involved in it

Get step-by-step solutions from verified subject matter experts