

Question: please show your complete solution and excel file, thank you Assignment: Analysis of Variance (ANOVA) Instruction: Please formulate the null and alternative hypothesis before you
please show your complete solution and excel file, thank you
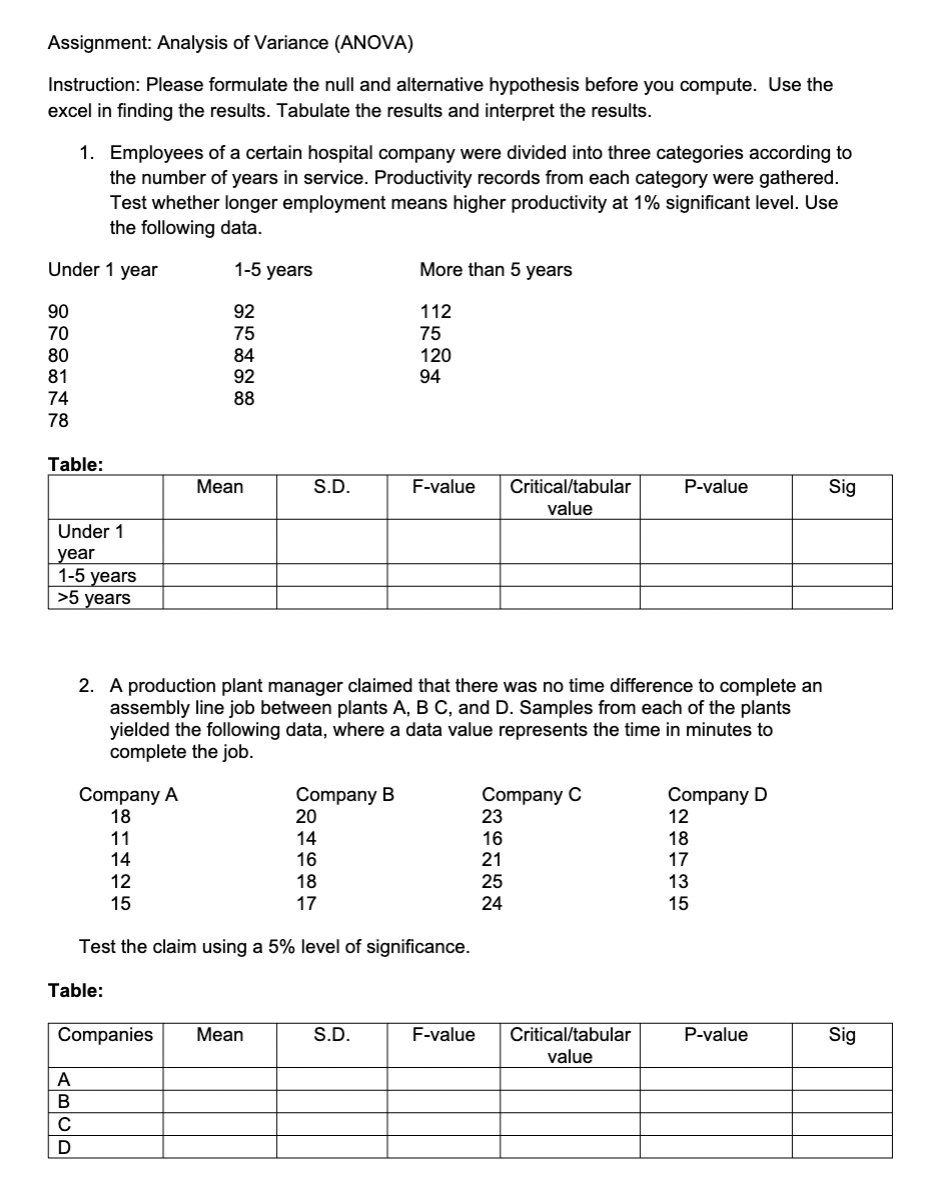
Assignment: Analysis of Variance (ANOVA) Instruction: Please formulate the null and alternative hypothesis before you compute. Use the excel in finding the results. Tabulate the results and interpret the results. 1. Employees of a certain hospital company were divided into three categories according to the number of years in service. Productivity records from each category were gathered. Test whether longer employment means higher productivity at 1% significant level. Use the following data. Under 1 year 1-5 years More than 5 years 90 92 112 70 75 75 80 84 120 81 92 94 74 88 78 Table: Mean S.D. F-value Critical/tabular P-value Sig value Under 1 year 1-5 years >5 years 2. A production plant manager claimed that there was no time difference to complete an assembly line job between plants A, B C, and D. Samples from each of the plants yielded the following data, where a data value represents the time in minutes to complete the job. Company A Company B Company C Company D 18 20 23 12 11 14 16 18 14 16 21 17 12 18 25 13 15 17 24 15 Test the claim using a 5% level of significance. Table: Companies Mean S.D. F-value Critical/tabular P-value Sig value A B D
Step by Step Solution
There are 3 Steps involved in it

Get step-by-step solutions from verified subject matter experts