

Question: Please show your work for 5a-5b. Use an Excel sheet to show your work. Northeast Airlines has 10 sales associates and wants to analyze the

Please show your work for 5a-5b. Use an Excel sheet to show your work.
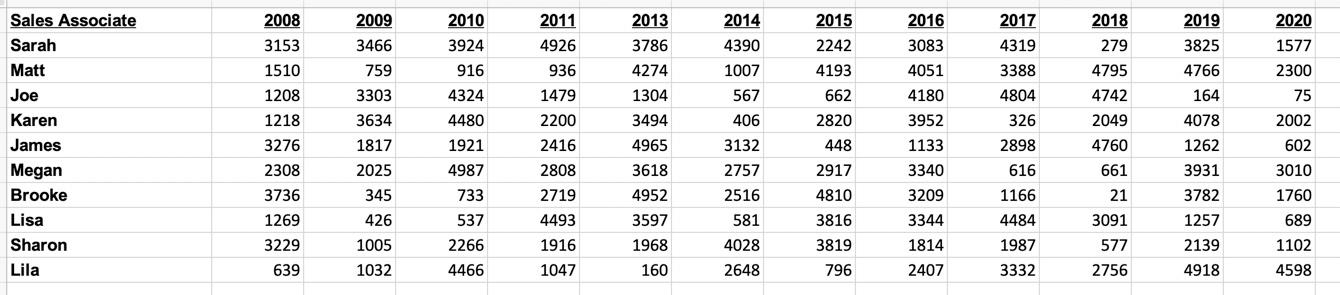
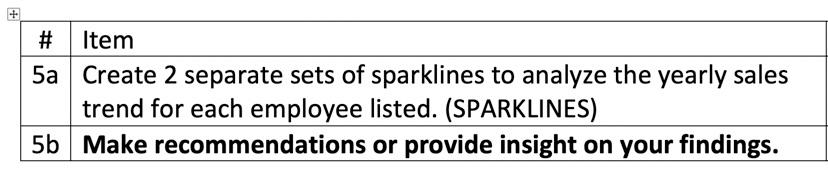
Northeast Airlines has 10 sales associates and wants to analyze the progress and trend of actual sales made for each associate. Look at the workbook and review the worksheet titled "Sales. 2009 3466 2010 3924 2011 4926 936 2016 3083 2008 3153 1510 1208 2018 279 2017 4319 3388 4804 916 4795 759 3303 4051 4180 2015 2242 4193 662 2820 448 2020 1577 2300 75 2002 4324 4742 Sales Associate Sarah Matt Joe Karen James Megan Brooke Lisa Sharon Lila 4480 2049 2019 3825 4766 164 4078 1262 3931 3634 1817 2025 2013 3786 4274 1304 3494 4965 3618 4952 3597 1968 160 1921 2014 4390 1007 567 406 3132 2757 2516 581 4028 2648 326 2898 3952 1133 3340 1479 2200 2416 2808 2719 4493 1916 4760 602 4987 2917 1218 3276 2308 3736 1269 3229 639 616 661 3010 345 4810 3209 1166 1760 426 3816 3344 4484 733 537 2266 4466 21 3091 577 2756 3782 1257 2139 4918 1005 3819 1814 1987 3332 689 1102 4598 1032 1047 796 2407 + # Item 5a Create 2 separate sets of sparklines to analyze the yearly sales trend for each employee listed. (SPARKLINES) 5b Make recommendations or provide insight on your findings. Northeast Airlines has 10 sales associates and wants to analyze the progress and trend of actual sales made for each associate. Look at the workbook and review the worksheet titled "Sales. 2009 3466 2010 3924 2011 4926 936 2016 3083 2008 3153 1510 1208 2018 279 2017 4319 3388 4804 916 4795 759 3303 4051 4180 2015 2242 4193 662 2820 448 2020 1577 2300 75 2002 4324 4742 Sales Associate Sarah Matt Joe Karen James Megan Brooke Lisa Sharon Lila 4480 2049 2019 3825 4766 164 4078 1262 3931 3634 1817 2025 2013 3786 4274 1304 3494 4965 3618 4952 3597 1968 160 1921 2014 4390 1007 567 406 3132 2757 2516 581 4028 2648 326 2898 3952 1133 3340 1479 2200 2416 2808 2719 4493 1916 4760 602 4987 2917 1218 3276 2308 3736 1269 3229 639 616 661 3010 345 4810 3209 1166 1760 426 3816 3344 4484 733 537 2266 4466 21 3091 577 2756 3782 1257 2139 4918 1005 3819 1814 1987 3332 689 1102 4598 1032 1047 796 2407 + # Item 5a Create 2 separate sets of sparklines to analyze the yearly sales trend for each employee listed. (SPARKLINES) 5b Make recommendations or provide insight on your findings
Step by Step Solution
There are 3 Steps involved in it

Get step-by-step solutions from verified subject matter experts