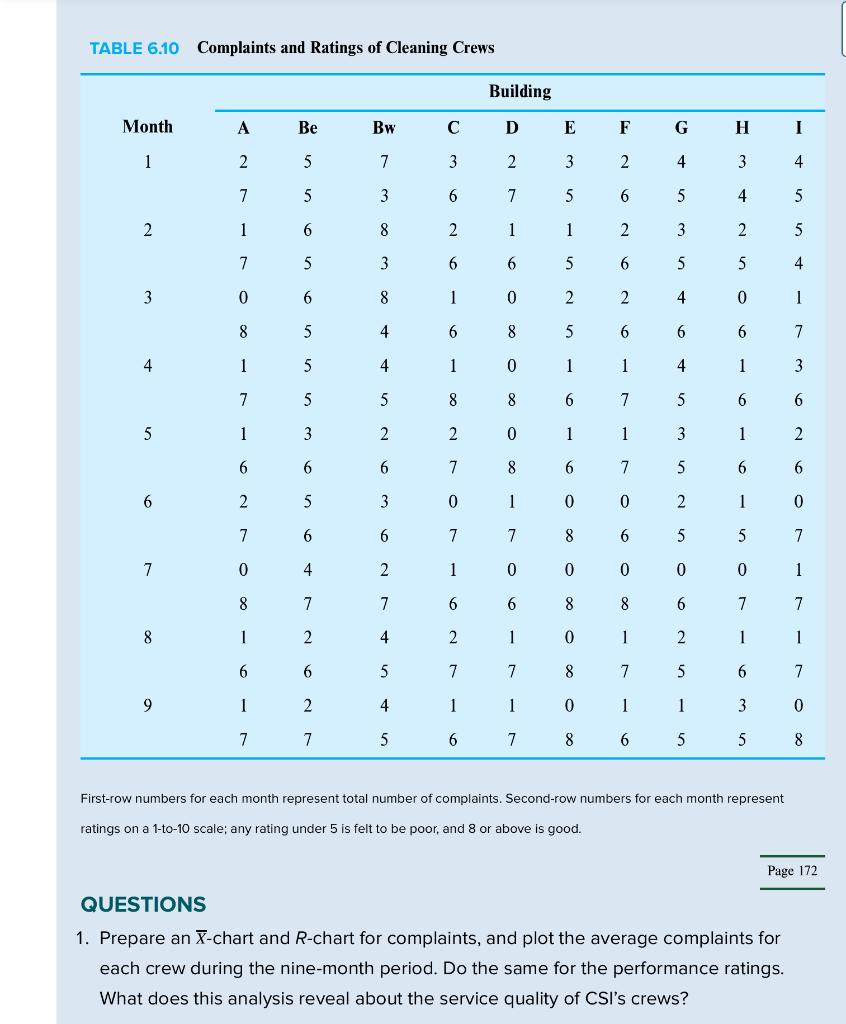
Question: please show your work. I would prefer an explanation without excel TABLE 6.10 Complaints and Ratings of Cleaning Crews First-row numbers for each month represent

please show your work. I would prefer anplease show your work. I would prefer an explanation without excel

TABLE 6.10 Complaints and Ratings of Cleaning Crews First-row numbers for each month represent total number of complaints. Second-row numbers for each month represent ratings on a 1-to-10 scale; any rating under 5 is felt to be poor, and 8 or above is good. QUESTIONS 1. Prepare an X-chart and R-chart for complaints, and plot the average complaints for each crew during the nine-month period. Do the same for the performance ratings. What does this analysis reveal about the service quality of CSI's crews

Step by Step Solution

There are 3 Steps involved in it

1 Expert Approved Answer
Step: 1 Unlock blur-text-image
Question Has Been Solved by an Expert!

Get step-by-step solutions from verified subject matter experts

Step: 2 Unlock
Step: 3 Unlock

Students Have Also Explored These Related General Management Questions!