

Question: Please show your work. Thank you! Problem 6 From the statistics collected for towns and cities in Illinois, the average consumption of water X, in
Please show your work. Thank you!
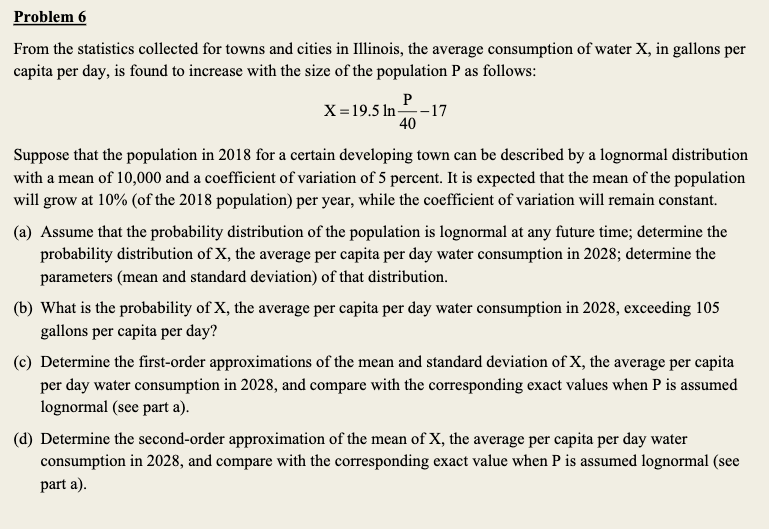
Problem 6 From the statistics collected for towns and cities in Illinois, the average consumption of water X, in gallons per capita per day, is found to increase with the size of the population P as follows: X =19.5 In P -17 40 Suppose that the population in 2018 for a certain developing town can be described by a lognormal distribution with a mean of 10,000 and a coefficient of variation of 5 percent. It is expected that the mean of the population will grow at 10% (of the 2018 population) per year, while the coefficient of variation will remain constant. (a) Assume that the probability distribution of the population is lognormal at any future time; determine the probability distribution of X, the average per capita per day water consumption in 2028; determine the parameters (mean and standard deviation) of that distribution. (b) What is the probability of X, the average per capita per day water consumption in 2028, exceeding 105 gallons per capita per day? (c) Determine the first-order approximations of the mean and standard deviation of X, the average per capita per day water consumption in 2028, and compare with the corresponding exact values when P is assumed lognormal (see part a). (d) Determine the second-order approximation of the mean of X, the average per capita per day water consumption in 2028, and compare with the corresponding exact value when P is assumed lognormal (see part a)
Step by Step Solution
There are 3 Steps involved in it

Get step-by-step solutions from verified subject matter experts