

Question: Please show your work! The Data Table and Aggregate Demand Forecast below provide information related to one of the major product lines of refrigerators for
Please show your work!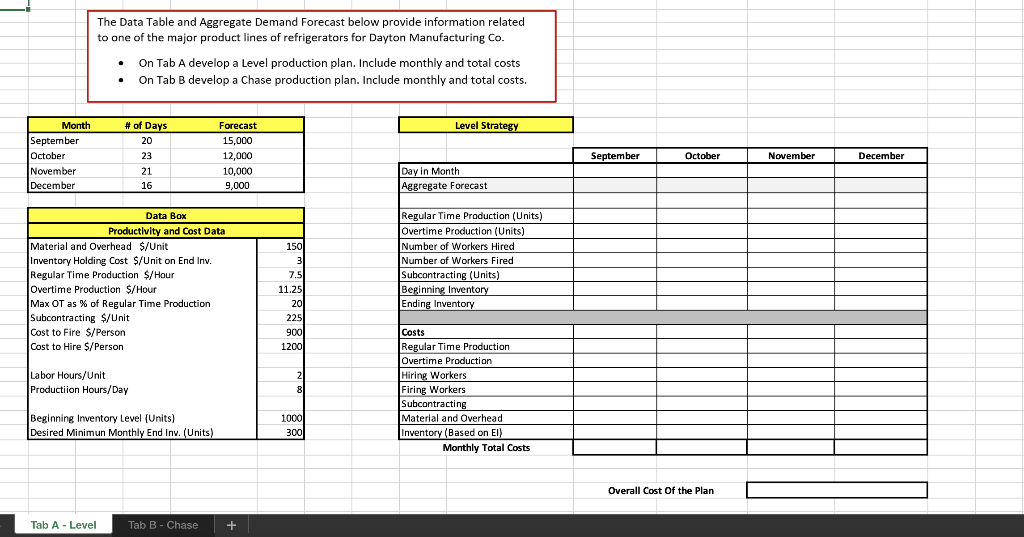
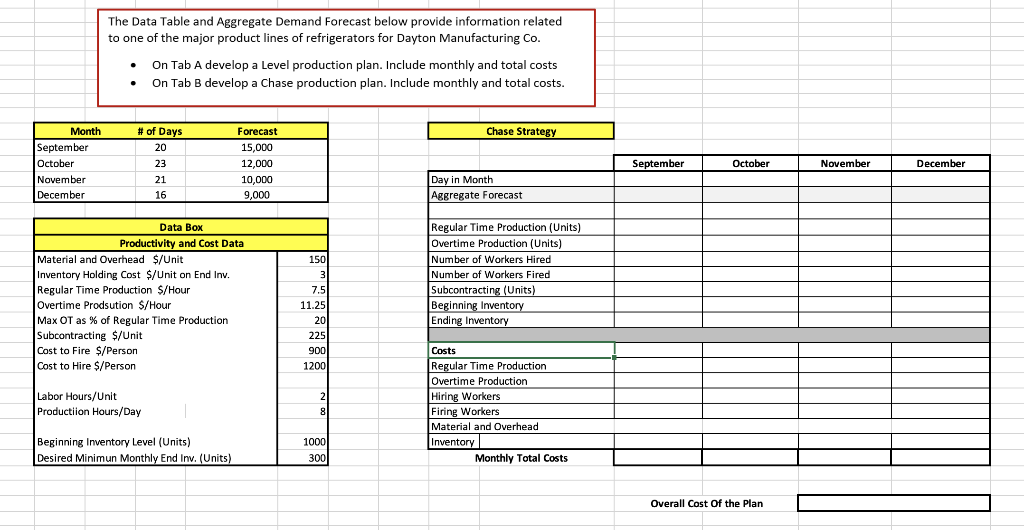
The Data Table and Aggregate Demand Forecast below provide information related to one of the major product lines of refrigerators for Dayton Manufacturing Co. On Tab A develop a Level production plan. Include monthly and total costs On Tab B develop a Chase production plan. Include monthly and total costs. # of Days Level Strategy Month September October November December Forecast 15,000 12,000 10,000 9,000 September October November 20 23 21 16 December Day In Month Aggregate Forecast Data Box Productivity and Cost Data Material and Overhead $/Unit Inventory Holding Cost $/Unit on End Inv. Regular Time Production S/ Hour Overtime Production $/Hour Max OT as % of Regular Time Production Subcontracting $/Unit Cost to Fire S/Person Cost to Hire $/Person 150 3 7.5 11.25 20 225 9001 1200 Regular Time Production (Units) Overtime Production (Units) Number of Workers Hired Number of Workers Fired Subcontracting (Units) Beginning Inventory Ending Inventory Labor Hours/Unit Production Hours/Day 2 8 Costs Regular Time Production Overtime Production Hiring Workers Firing Workers Subcontracting Material and Overhead Inventory (Based on El) Monthly Total Costs Beginning Inventory Level (Units) Desired Minimun Monthly End Inv. (Units) 1000 300 Overall Cost of the Plan Tab A - Level Tab B - Chase + + The Data Table and Aggregate Demand Forecast below provide information related to one of the major product lines of refrigerators for Dayton Manufacturing Co. On Tab A develop a Level production plan. Include monthly and total costs On Tab B develop a Chase production plan. Include monthly and total costs. Chase Strategy Month September October November December # of Days 20 23 21 16 Forecast 15,000 12,000 10,000 9,000 September October November December Day in Month Aggregate Forecast Data Box Productivity and Cost Data Material and Overhead $/Unit Inventory Holding Cost $/Unit on End Inv. Regular Time Production S/Hour Overtime Prodsution S/Hour Max OT as % of Regular Time Production Subcontracting $/Unit Cost to Fire $/Person Cost to Hire S/Person 150 3 7.5 11.25 20 225 900 1200 Regular Time Production (Units) Overtime Production (Units) Number of Workers Hired Number of Workers Fired Subcontracting (Units) Beginning Inventory Ending Inventory Labor Hours/Unit Production Hours/Day 2 8 Costs Regular Time Production Overtime Production Hiring Workers Firing Workers Material and Overhead Inventory Monthly Total Costs Beginning Inventory Level (Units) Desired Minimun Monthly End Inv. (Units) 1000 300 Overall Cost of the Plan The Data Table and Aggregate Demand Forecast below provide information related to one of the major product lines of refrigerators for Dayton Manufacturing Co. On Tab A develop a Level production plan. Include monthly and total costs On Tab B develop a Chase production plan. Include monthly and total costs. # of Days Level Strategy Month September October November December Forecast 15,000 12,000 10,000 9,000 September October November 20 23 21 16 December Day In Month Aggregate Forecast Data Box Productivity and Cost Data Material and Overhead $/Unit Inventory Holding Cost $/Unit on End Inv. Regular Time Production S/ Hour Overtime Production $/Hour Max OT as % of Regular Time Production Subcontracting $/Unit Cost to Fire S/Person Cost to Hire $/Person 150 3 7.5 11.25 20 225 9001 1200 Regular Time Production (Units) Overtime Production (Units) Number of Workers Hired Number of Workers Fired Subcontracting (Units) Beginning Inventory Ending Inventory Labor Hours/Unit Production Hours/Day 2 8 Costs Regular Time Production Overtime Production Hiring Workers Firing Workers Subcontracting Material and Overhead Inventory (Based on El) Monthly Total Costs Beginning Inventory Level (Units) Desired Minimun Monthly End Inv. (Units) 1000 300 Overall Cost of the Plan Tab A - Level Tab B - Chase + + The Data Table and Aggregate Demand Forecast below provide information related to one of the major product lines of refrigerators for Dayton Manufacturing Co. On Tab A develop a Level production plan. Include monthly and total costs On Tab B develop a Chase production plan. Include monthly and total costs. Chase Strategy Month September October November December # of Days 20 23 21 16 Forecast 15,000 12,000 10,000 9,000 September October November December Day in Month Aggregate Forecast Data Box Productivity and Cost Data Material and Overhead $/Unit Inventory Holding Cost $/Unit on End Inv. Regular Time Production S/Hour Overtime Prodsution S/Hour Max OT as % of Regular Time Production Subcontracting $/Unit Cost to Fire $/Person Cost to Hire S/Person 150 3 7.5 11.25 20 225 900 1200 Regular Time Production (Units) Overtime Production (Units) Number of Workers Hired Number of Workers Fired Subcontracting (Units) Beginning Inventory Ending Inventory Labor Hours/Unit Production Hours/Day 2 8 Costs Regular Time Production Overtime Production Hiring Workers Firing Workers Material and Overhead Inventory Monthly Total Costs Beginning Inventory Level (Units) Desired Minimun Monthly End Inv. (Units) 1000 300 Overall Cost of the Plan
Step by Step Solution
There are 3 Steps involved in it

Get step-by-step solutions from verified subject matter experts