

Question: Please show your work using graphs as seen fit. Underline the final answer upon solving the following problems: Only answer number 2 1. Given that
 Please show your work using graphs as seen fit. Underline the final answer upon solving the following problems:
Only answer number 2
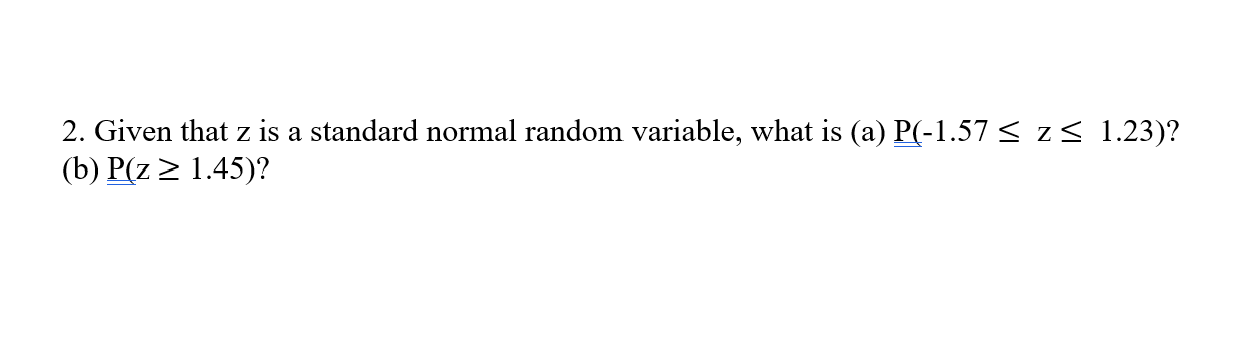
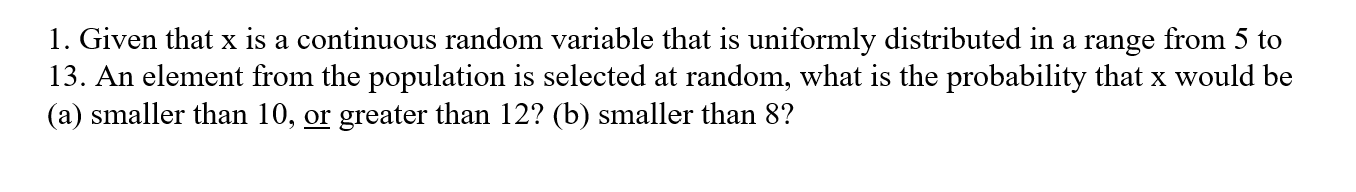
1. Given that x is a continuous random variable that is uniformly distributed in a range from 5 to 13. An element from the population is selected at random, what is the probability that x would be (a) smaller than 10, or greater than 12? (b) smaller than 8? 2. Given that z is a standard normal random variable, what is (a) P(-1.57 5 zs 1.23)? (b) P(z > 1.45)? 1. Given that x is a continuous random variable that is uniformly distributed in a range from 5 to 13. An element from the population is selected at random, what is the probability that x would be (a) smaller than 10, or greater than 12? (b) smaller than 8? 2. Given that z is a standard normal random variable, what is (a) P(-1.57 5 zs 1.23)? (b) P(z > 1.45)
Step by Step Solution
There are 3 Steps involved in it

Get step-by-step solutions from verified subject matter experts