

Question: please snswer the two questions. fill in the boxes. thumps up when both are answered. Spreadsheets are useful for computing statistics: averages, standard deviation, variance,
please snswer the two questions. fill in the boxes. thumps up when both are answered. 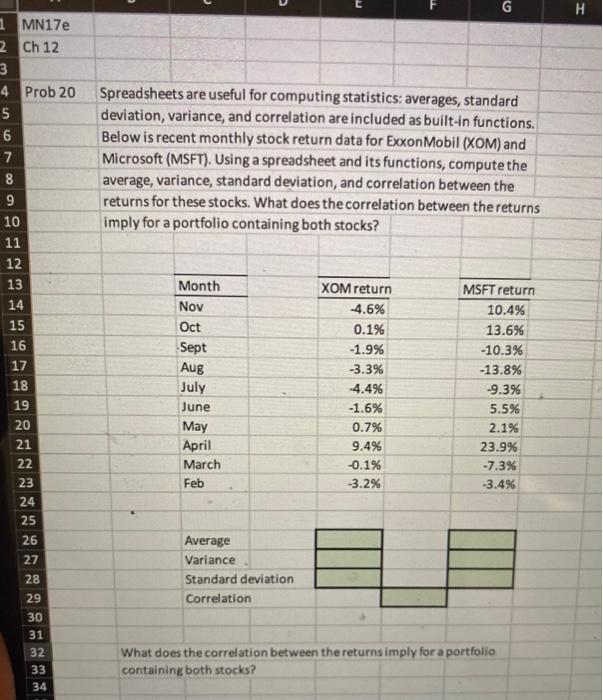
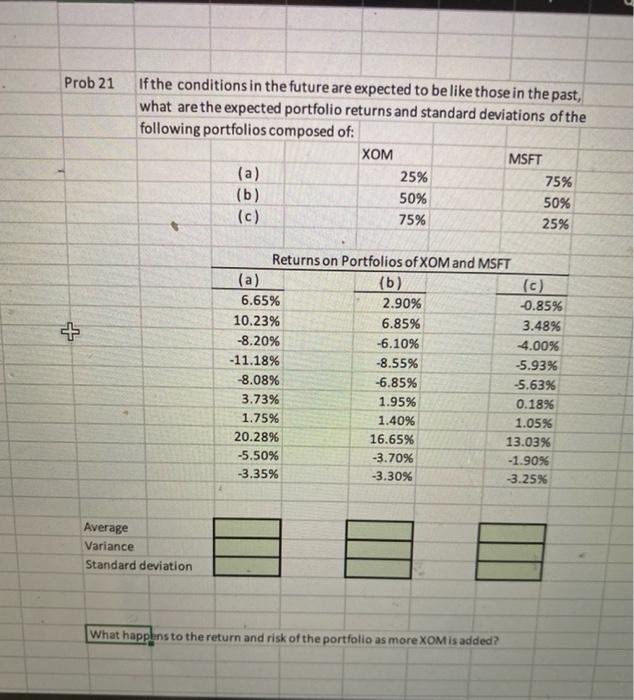
Spreadsheets are useful for computing statistics: averages, standard deviation, variance, and correlation are included as built-in functions. Below is recent monthly stock return data for ExxonMobil (XOM) and Microsoft (MSFT). Using a spreadsheet and its functions, compute the average, variance, standard deviation, and correlation between the returns for these stocks. What does the correlation between the returns imply for a portfolio containino hoth ctarke? Standard deviation Correlation What does the correlation between the returns imply for a portfolio containing both stocks? Prob 21 If the conditions in the future are expected to be like those in the past, what are the expected portfolio returns and standard deviations of the following portfolios composed of: What happlens to the return and risk of the portfolio as more XOM is added Step by Step Solution
There are 3 Steps involved in it
1 Expert Approved Answer
Step: 1 Unlock

Question Has Been Solved by an Expert!
Get step-by-step solutions from verified subject matter experts
Step: 2 Unlock
Step: 3 Unlock