

Question: .... please solve.. 2) Consider the following demand and supply functions: Qi =24-4P, demand Q;=-6+2E,_,P, supply and expectations generator E, _P. = P, a) Calculate


.... please solve..
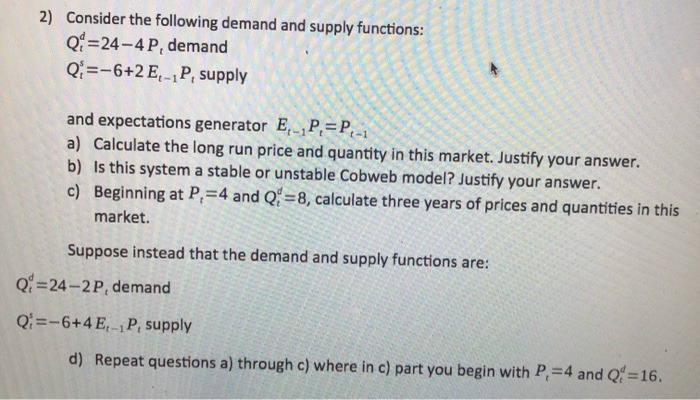

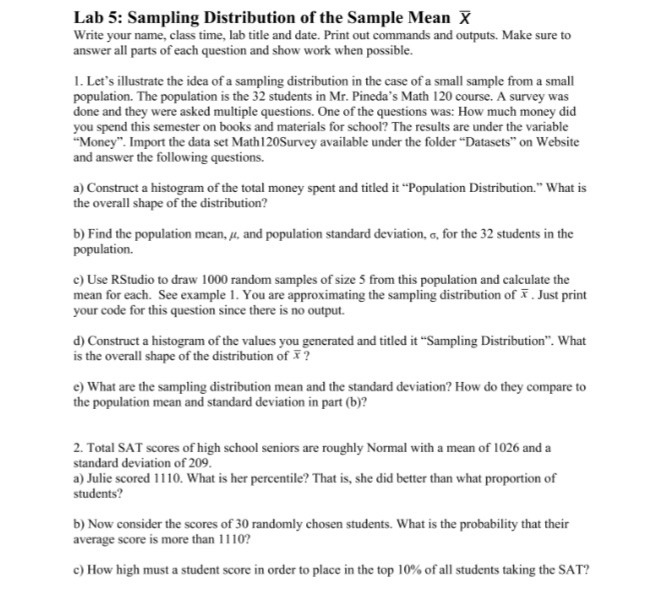

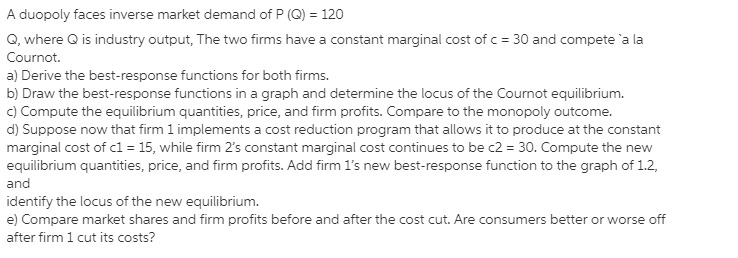
2) Consider the following demand and supply functions: Qi =24-4P, demand Q;=-6+2E,_,P, supply and expectations generator E, _P. = P, a) Calculate the long run price and quantity in this market. Justify your answer. b) Is this system a stable or unstable Cobweb model? Justify your answer. c) Beginning at P, =4 and Q, =8, calculate three years of prices and quantities in this market. Suppose instead that the demand and supply functions are: Qi =24-2P, demand Q;=-6+4E,_P, supply d) Repeat questions a) through c) where in c) part you begin with P, =4 and Q =16.A duopoly faces inverse market demand of P (Q) = 120 Q, where Q is industry output, The two firms have a constant marginal cost of c = 30 and compete 'a la Cournot. a) Derive the best-response functions for both firms. b) Draw the best-response functions in a graph and determine the locus of the Cournot equilibrium. c) Compute the equilibrium quantities, price, and firm profits. Compare to the monopoly outcome. d) Suppose now that firm 1 implements a cost reduction program that allows it to produce at the constant marginal cost of cl = 15, while firm 2's constant marginal cost continues to be c2 = 30. Compute the new equilibrium quantities, price, and firm profits. Add firm 1's new best-response function to the graph of 1.2, and identify the locus of the new equilibrium. e) Compare market shares and firm profits before and after the cost cut. Are consumers better or worse off after firm 1 cut its costs?Lab 5: Sampling Distribution of the Sample Mean X Write your name, class time, lab title and date. Print out commands and outputs, Make sure to answer all parts of each question and show work when possible. 1. Let's illustrate the idea of a sampling distribution in the case of a small sample from a small population. The population is the 32 students in Mr. Pineda's Math 120 course. A survey was done and they were asked multiple questions. One of the questions was: How much money did you spend this semester on books and materials for school? The results are under the variable "Money". Import the data set Math 120Survey available under the folder "Datasets" on Website and answer the following questions. a) Construct a histogram of the total money spent and titled it "Population Distribution." What is the overall shape of the distribution? b) Find the population mean, #, and population standard deviation, a, for the 32 students in the population. c) Use RStudio to draw 1000 random samples of size 5 from this population and calculate the mean for each. See example 1. You are approximationg the sampling distribution of X . Just print your code for this question since there is no output. d) Construct a histogram of the values you generated and titled it "Sampling Distribution". What is the overall shape of the distribution of X ? e) What are the sampling distribution mean and the standard deviation? How do they compare to the population mean and standard deviation in part (b)? 2. Total SAT scores of high school seniors are roughly Normal with a mean of 1026 and a standard deviation of 209. a) Julie scored 1110. What is her percentile? That is, she did better than what proportion of students? b) Now consider the scores of 30 randomly chosen students. What is the probability that their average score is more than 1 1 10? c) How high must a student score in order to place in the top 10% of all students taking the SAT?9. In case of monopoly, a firm in the long run can have almondoil Baghlead A. Loss B. Super Normal Profit C. Break even D. All of these sham I eshso noltesup nose .lower's /461509 10. Income elasticity is computed by A. ei = (Y2 - Y1) / e1 vo beoubount esw noblegnoc toll B. ei = (Y1 - Y2 ) / P1 ei = ( (Q2 - Q1 ) / Q1 ) / ( (Y2 - Y1 ) / Y1) D. ei = (Q2 - Q1 ) / P1 belles ri toyud ano ying al 91or evenw. None Section B Answer any 5 questions. Each question carries 6 marks. (6x5=30 marks) 11. Law Of Equi Marginal Utility ? 12. Explain Law Of Demand & It's Exceptions ? (or) Why Demand Curve Slopes From Left To Right ? 13. Diminishing returns to Scale ? or Variable Proportional To Scale ? 14. Difference Between Perfect Competition and Monopoly 15. What is Trade Cycles ? Explain Its Fluctuation ? 16. What is Utility? Explain various types of Utility? 17. Why does a Demand curve has a negative slope? 18. Explain any three definitions of National Income Section C Answer any 3 questions. Each question carries 10 marks. (3x10=30 marks) 19. Explain law of Equi Marginal Utility? 20. What is Monopoly? Explain how price determination under Monopoly. 21. Explain the difficulties of Barter System 22. State any three major functions of Central Bank 23. Explain the classifications of Markets? 24. What are the various methods of Debt redumption
Step by Step Solution
There are 3 Steps involved in it

Get step-by-step solutions from verified subject matter experts