

Question: Please solve (2) round2 (3) round3 (4) round4 (5)round5 (6) round6 4.Analysis one ROE(Retrun of equity) and describe what you learned from this experiment The
Please solve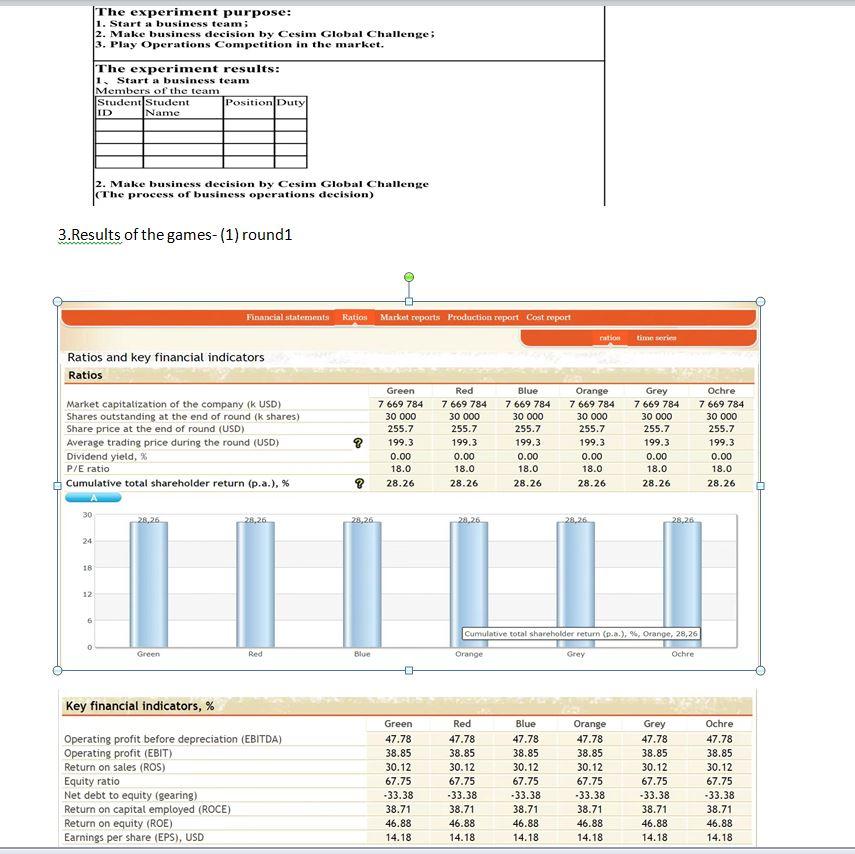 (2) round2
(3) round3
(4) round4
(5)round5
(6) round6
4.Analysis one ROE(Retrun of equity) and describe what you learned from this experiment
The experiment purpose: 1. Start a business team; 2. Make business decision by Cesim Global Challenge; 3. Play Operations Competition in the market. The experiment results: 1. Start a business team Members of the team Student Student Position Duty ID Name 2. Make business decision by Cesim Global Challenge (The process of business operations decision) 3.Results of the games- (1) round1 Ratios and key financial indicators Ratios Market capitalization of the company (k USD) Shares outstanding at the end of round (k shares) Share price at the end of round (USD) Average trading price during the round (USD) Dividend yield, % P/E ratio Cumulative total shareholder return (p.a.), % 30 28,26 28,26 24 18 12 6 0 Green Red Key financial indicators, % Operating profit before depreciation (EBITDA) Operating profit (EBIT) Return on sales (ROS) Equity ratio Net debt to equity (gearing) Return on capital employed (ROCE) Return on equity (ROE) Earnings per share (EPS), USD Financial statements Ration Market reports Production report Cost report Green Red Blue 7 669 784 7 669 784 7 669 784 30 000 255.7 30 000 30 000 255.7 255.7 199.3 199.3 199.3 0.00 0.00 0.00 18.0 18.0 18.0 28.26 28.26 28,26 ? ? 28,26 Blue Green 47.78 38.85 30.12 67.75 -33.38 38.71 46.88 14.18 ration Orange 7 669 784 30 000 255.7 199.3 0.00 18.0 28.26 time series Grey 7 669 784 30 000 255.7 199.3 0.00 18.0 28.26 28,26 28,26 28,26 Cumulative total shareholder return (p.a.), %, Orange, 28,26 Orange Grey Ochre Red Blue 47.78 47.78 38.85 38.85 30.12 30.12 67.75 67.75 -33.38 -33.38 38.71 38.71 46.88 46.88 14.18 14.18 Orange 47.78 38.85 30.12 67.75 -33.38 38.71 46.88 14.18 Grey 47.78 38.85 30.12 67.75 -33.38 38.71 46.88 14.18 Ochre 7 669 784 30 000 255.7 199.3 0.00 18.0 28.26 Ochre 47.78 38.85 30.12 67.75 -33.38 38.71 46.88 14.18 The experiment purpose: 1. Start a business team; 2. Make business decision by Cesim Global Challenge; 3. Play Operations Competition in the market. The experiment results: 1. Start a business team Members of the team Student Student Position Duty ID Name 2. Make business decision by Cesim Global Challenge (The process of business operations decision) 3.Results of the games- (1) round1 Ratios and key financial indicators Ratios Market capitalization of the company (k USD) Shares outstanding at the end of round (k shares) Share price at the end of round (USD) Average trading price during the round (USD) Dividend yield, % P/E ratio Cumulative total shareholder return (p.a.), % 30 28,26 28,26 24 18 12 6 0 Green Red Key financial indicators, % Operating profit before depreciation (EBITDA) Operating profit (EBIT) Return on sales (ROS) Equity ratio Net debt to equity (gearing) Return on capital employed (ROCE) Return on equity (ROE) Earnings per share (EPS), USD Financial statements Ration Market reports Production report Cost report Green Red Blue 7 669 784 7 669 784 7 669 784 30 000 255.7 30 000 30 000 255.7 255.7 199.3 199.3 199.3 0.00 0.00 0.00 18.0 18.0 18.0 28.26 28.26 28,26 ? ? 28,26 Blue Green 47.78 38.85 30.12 67.75 -33.38 38.71 46.88 14.18 ration Orange 7 669 784 30 000 255.7 199.3 0.00 18.0 28.26 time series Grey 7 669 784 30 000 255.7 199.3 0.00 18.0 28.26 28,26 28,26 28,26 Cumulative total shareholder return (p.a.), %, Orange, 28,26 Orange Grey Ochre Red Blue 47.78 47.78 38.85 38.85 30.12 30.12 67.75 67.75 -33.38 -33.38 38.71 38.71 46.88 46.88 14.18 14.18 Orange 47.78 38.85 30.12 67.75 -33.38 38.71 46.88 14.18 Grey 47.78 38.85 30.12 67.75 -33.38 38.71 46.88 14.18 Ochre 7 669 784 30 000 255.7 199.3 0.00 18.0 28.26 Ochre 47.78 38.85 30.12 67.75 -33.38 38.71 46.88 14.18
Step by Step Solution
There are 3 Steps involved in it

Get step-by-step solutions from verified subject matter experts