

Question: Please solve 9. [0.12103 Points] DETAILS PREVIOUS ANSWERS BBUNDERSTAT12 9.2.021.NVA MY NOTES ASK YOUR TEACHER PRACTICE ANOTHER (a) Suppose you are given the following
Please solve
![Please solve \\ 9. [0.12103 Points] DETAILS PREVIOUS ANSWERS BBUNDERSTAT12 9.2.021.NVA MY](https://dsd5zvtm8ll6.cloudfront.net/si.experts.images/questions/2024/10/670695545ac8b_692670695541accc.jpg)
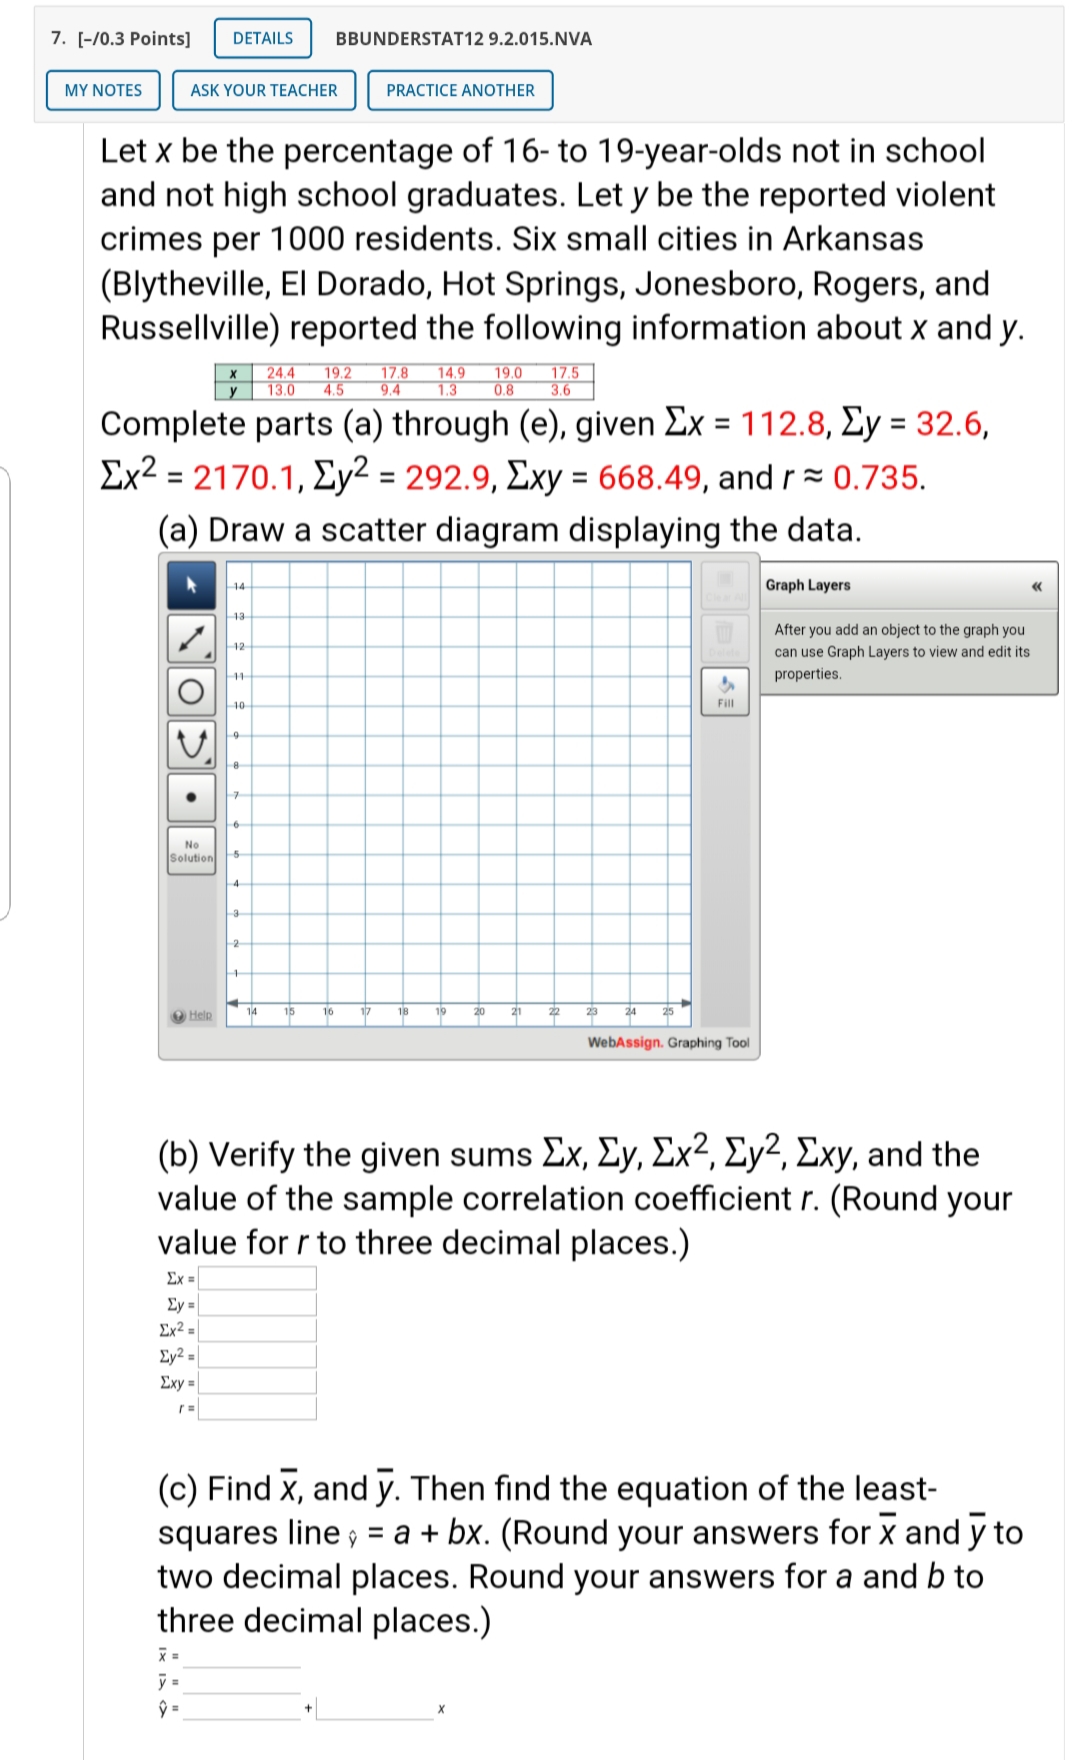
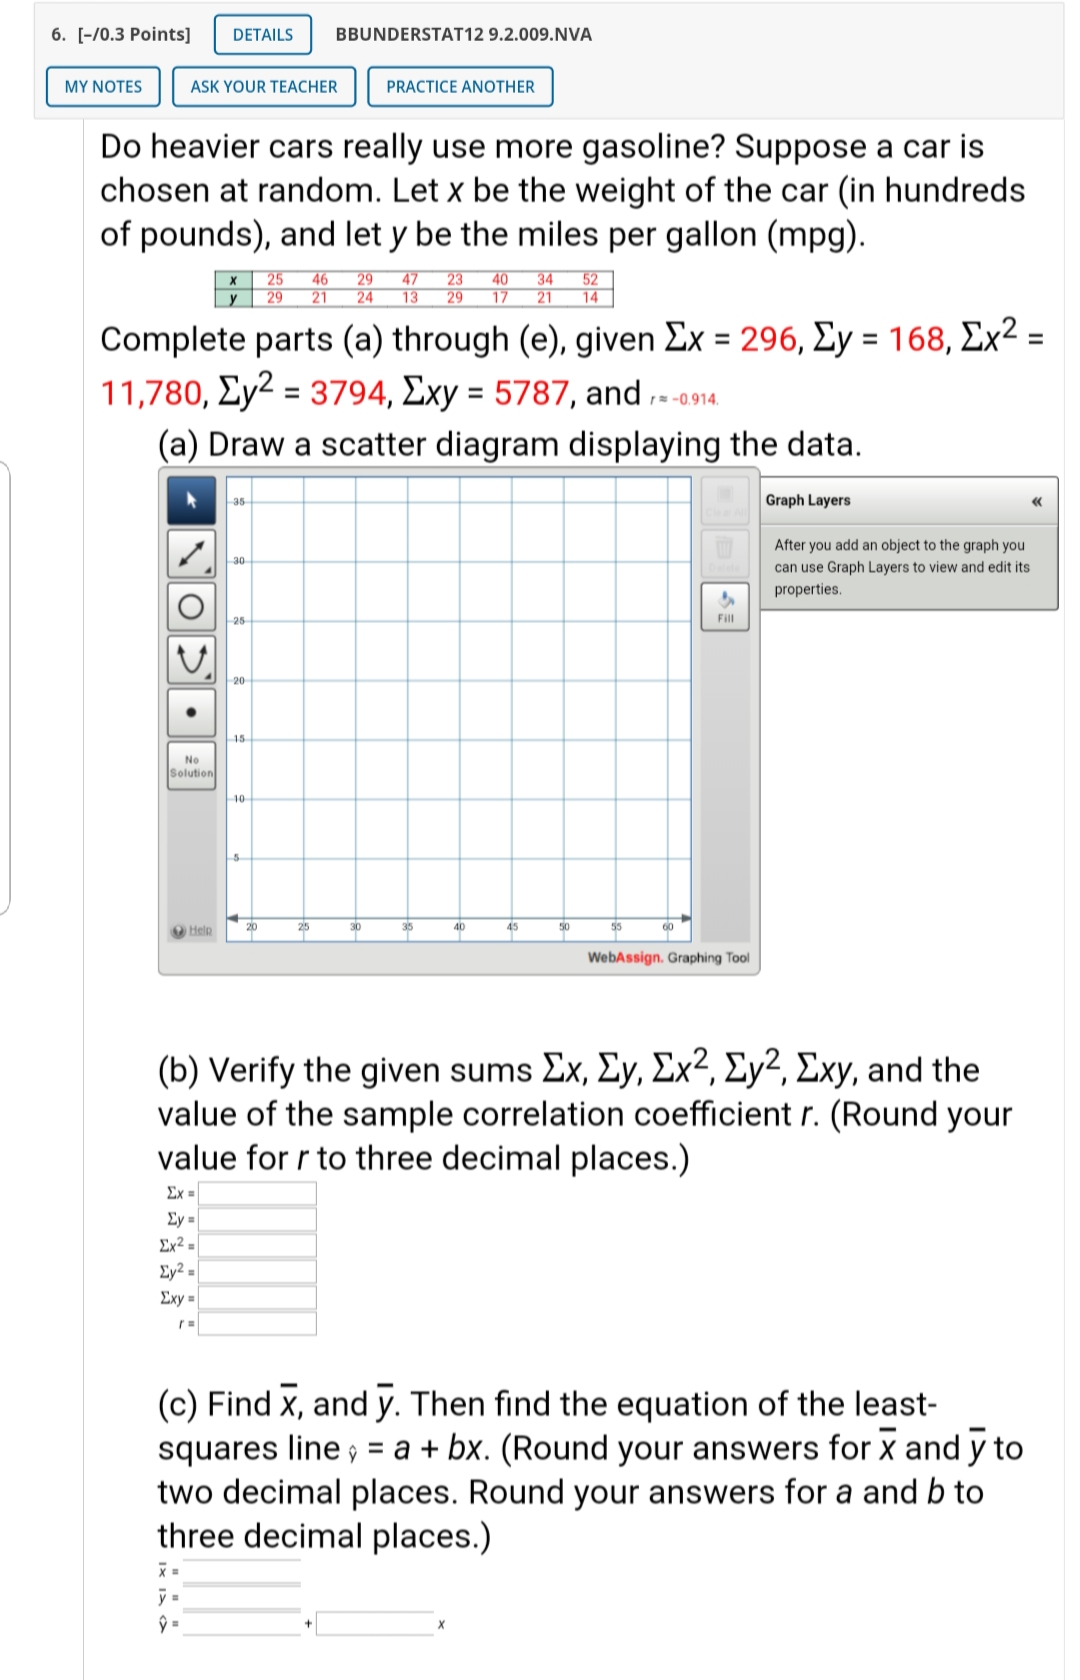
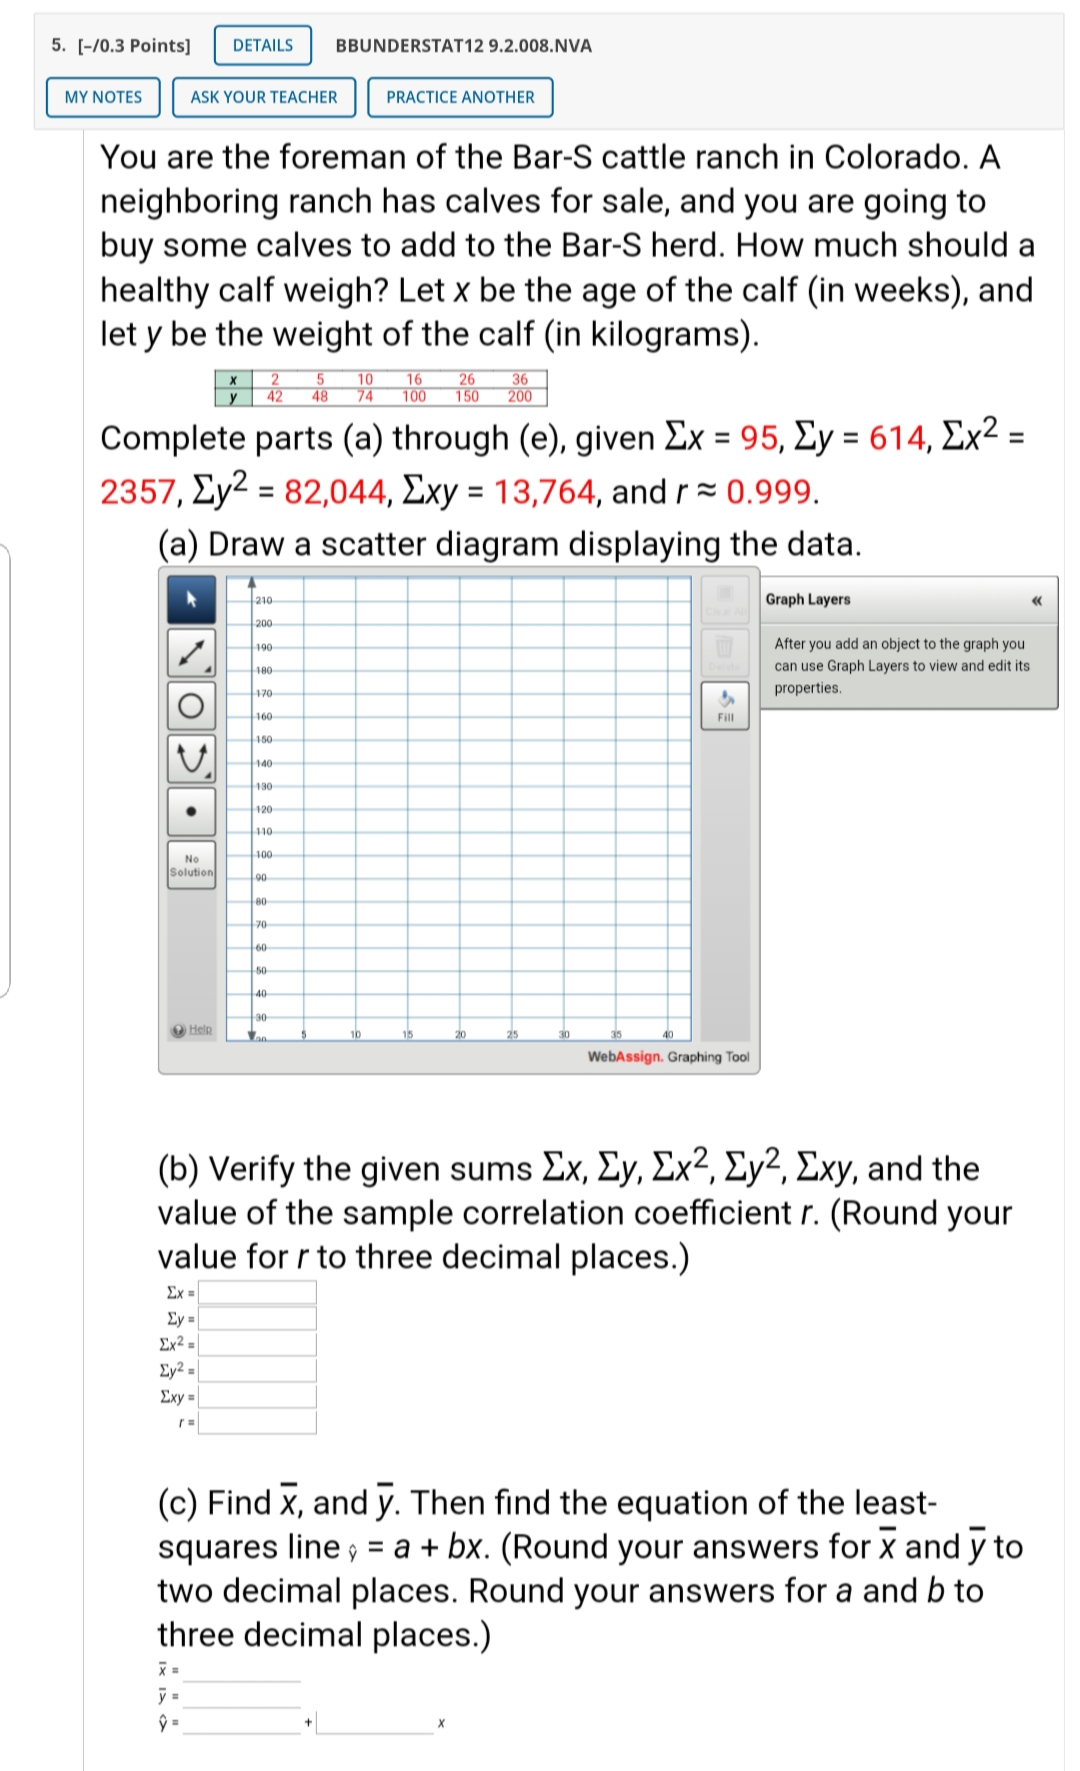
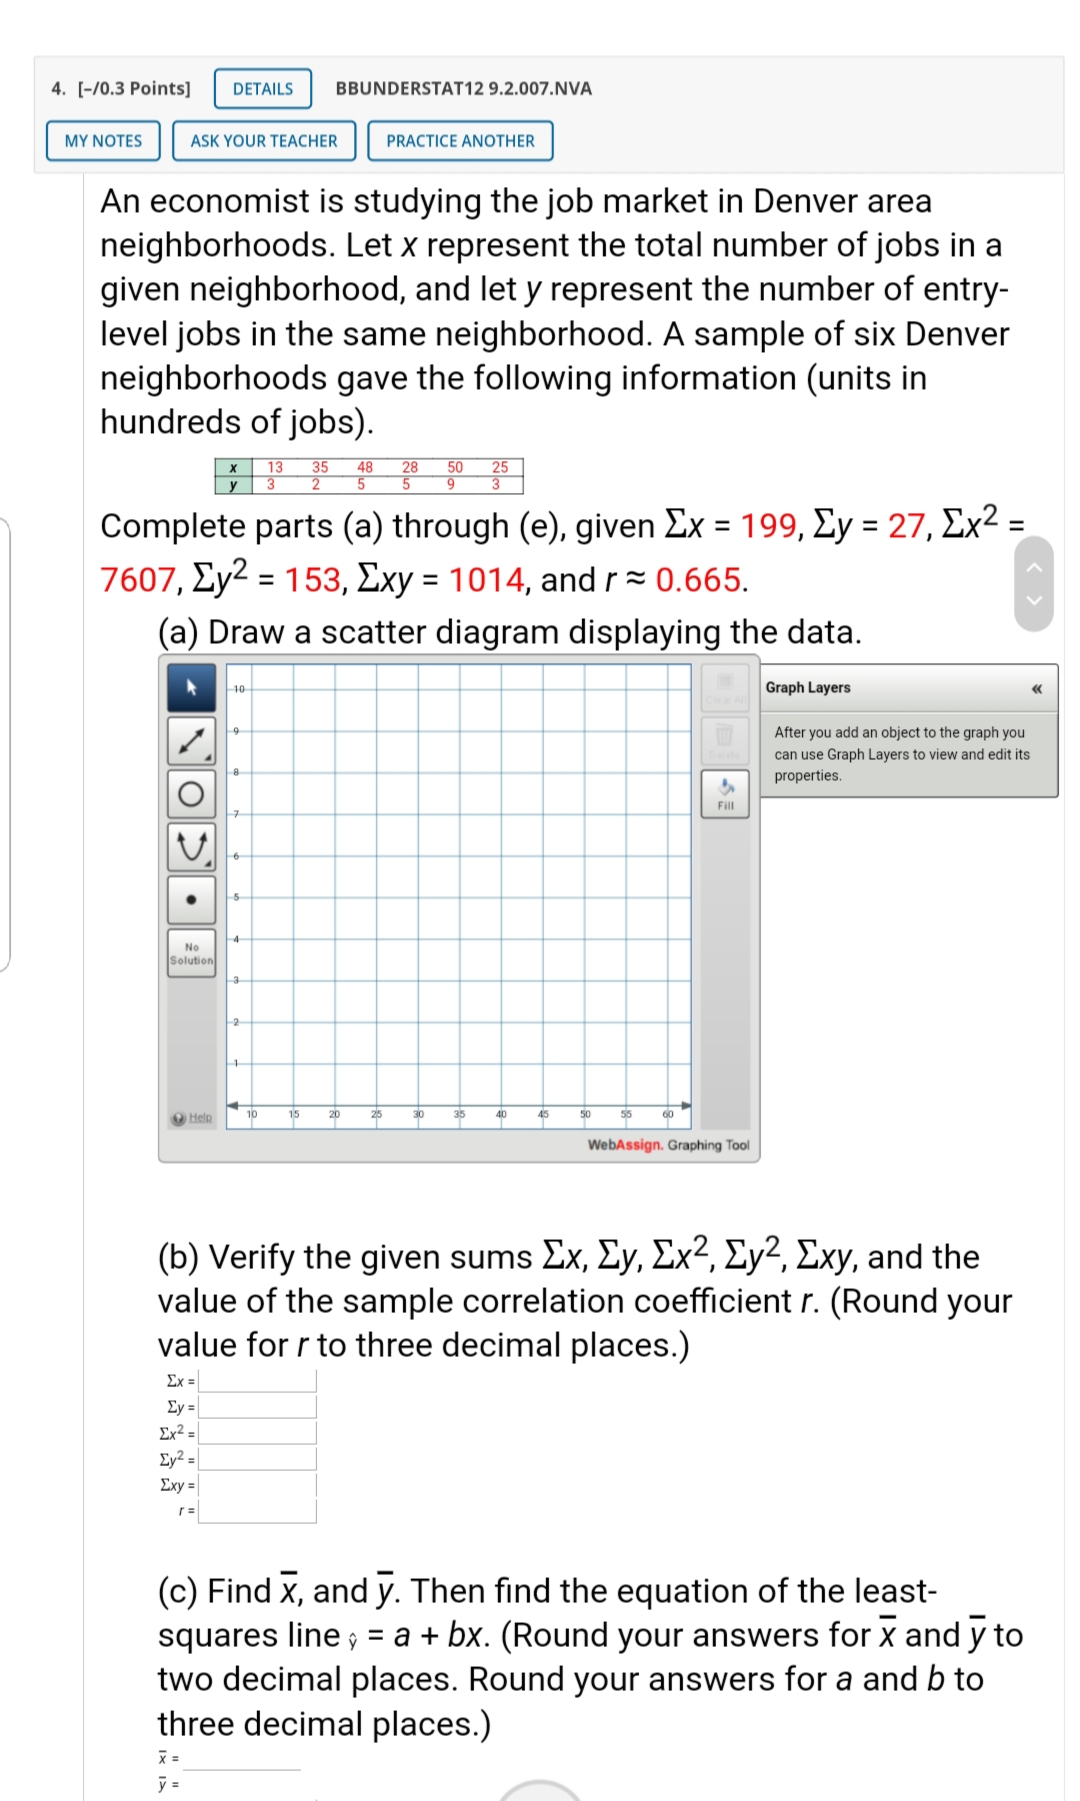
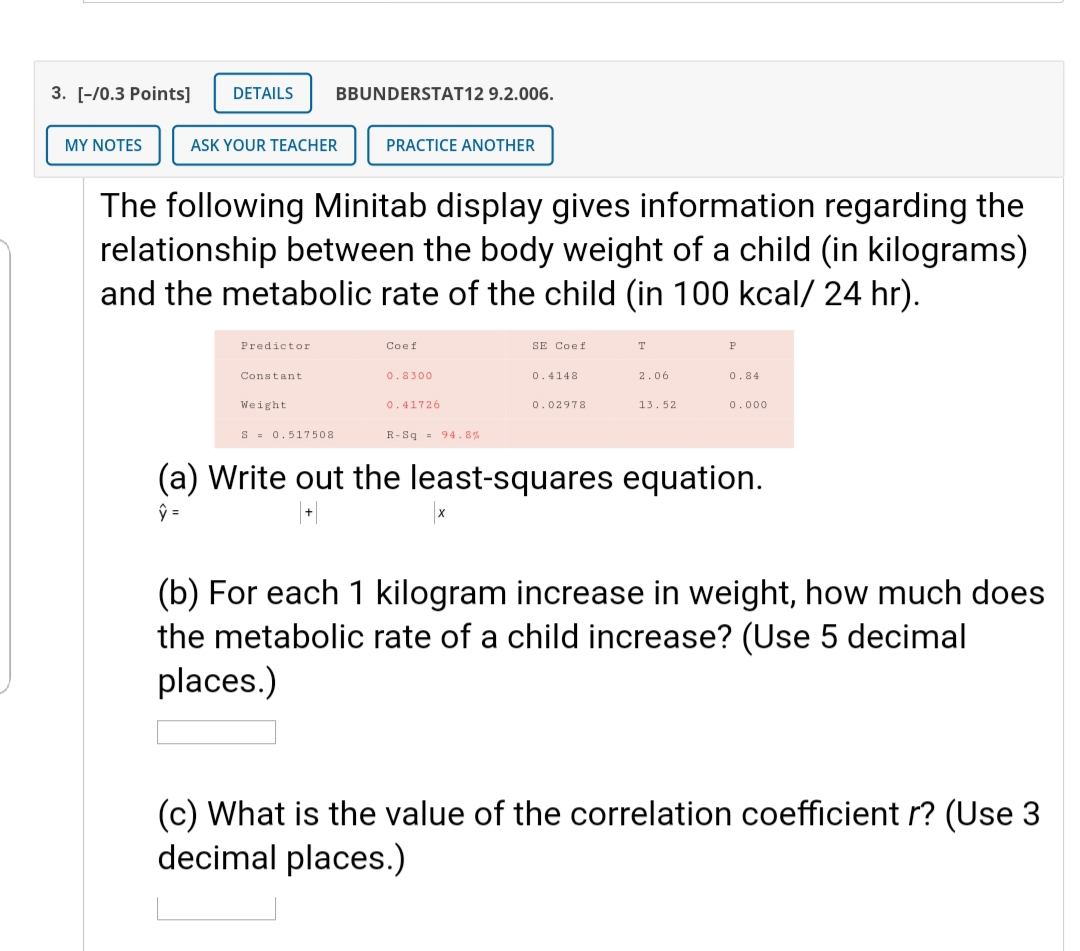
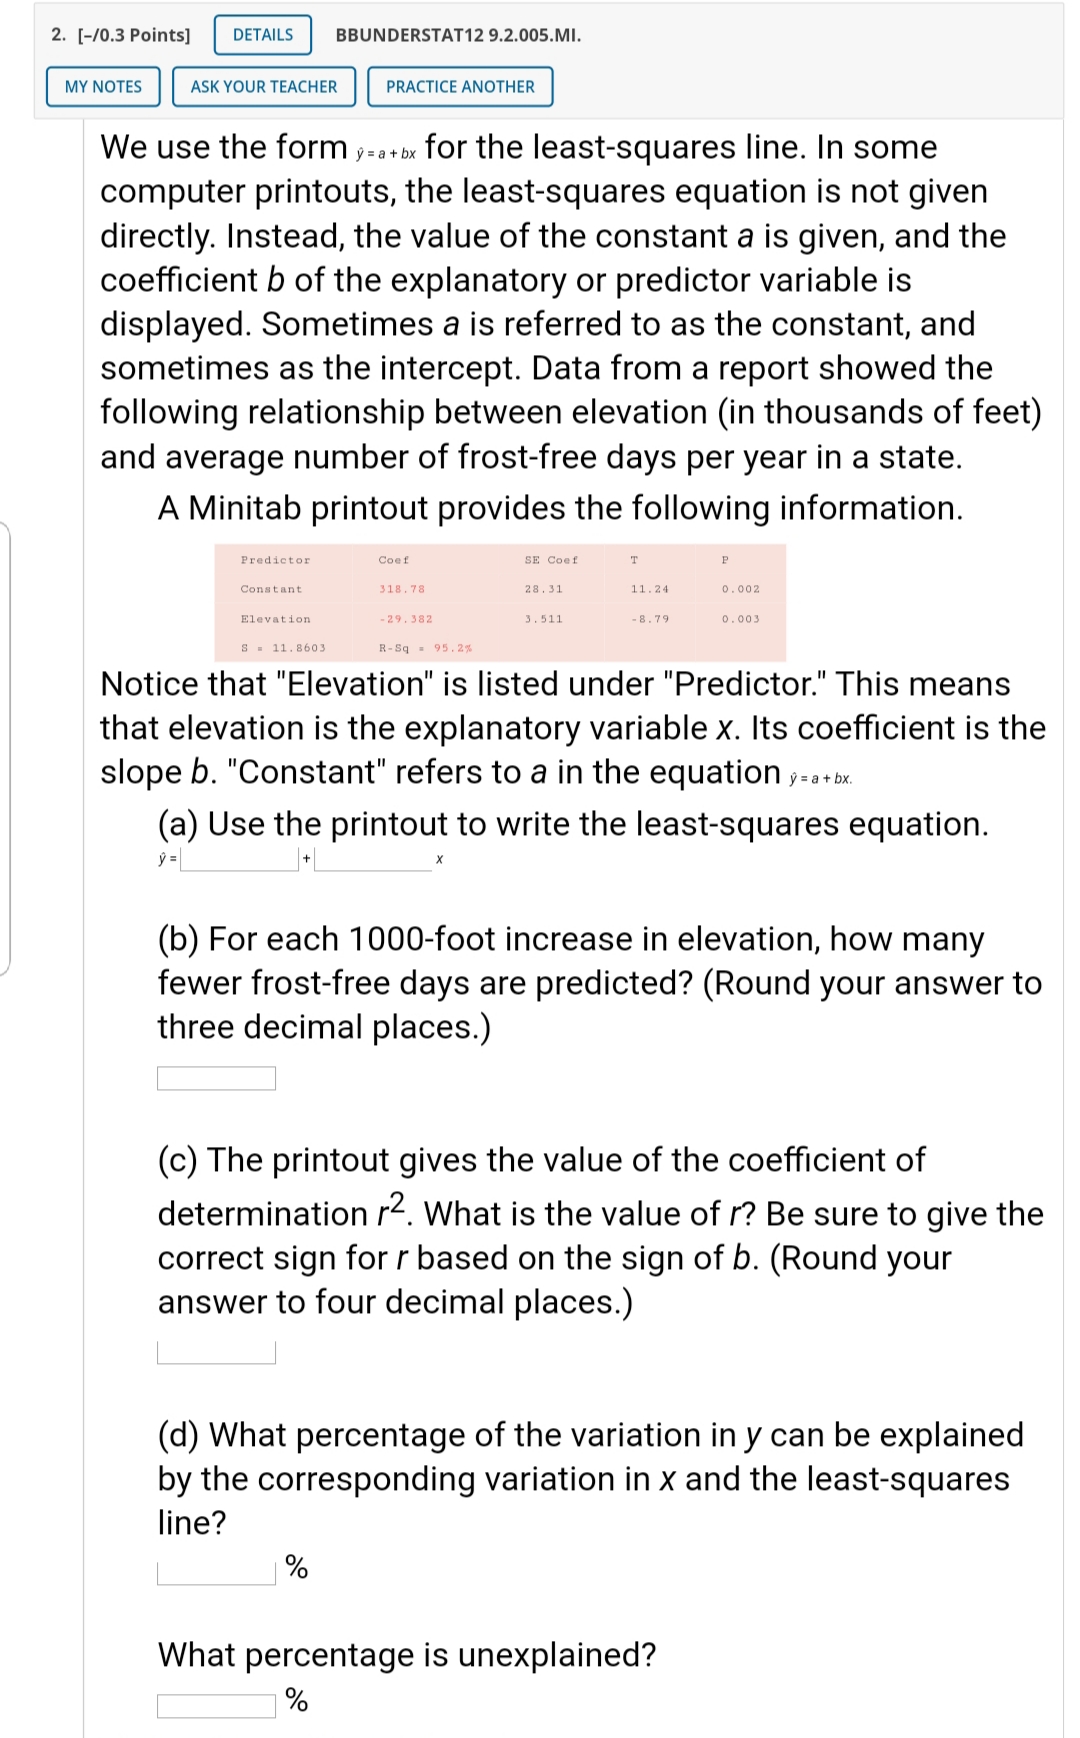
\\ 9. [0.12103 Points] DETAILS PREVIOUS ANSWERS BBUNDERSTAT12 9.2.021.NVA MY NOTES ASK YOUR TEACHER PRACTICE ANOTHER (a) Suppose you are given the following (x, y) data pairs. \"134 "439 Find the least-squares equation for these data (rounded to three digits after the decimal). y= + x (b) Now suppose you are given these (x, y) data pairs. um "134 Find the least-squares equation for these data (rounded to three digits after the decimal). )7 =| I+ |X (c) In the data for parts (a) and (b), did we simply exchange the x and y values of each data pair? 0 Yes No v (d) Solve your answer from part (a) for X (rounded to three digits after the decimal). X = I+ Iy 7. [-/0.3 Points] DETAILS BBUNDERSTAT12 9.2.015.NVA MY NOTES ASK YOUR TEACHER PRACTICE ANOTHER Let x be the percentage of 16- to 19-year-olds not in school and not high school graduates. Let y be the reported violent crimes per 1000 residents. Six small cities in Arkansas (Blytheville, El Dorado, Hot Springs, Jonesboro, Rogers, and Russellville) reported the following information about x and y. 24.4 19.2 17.8 14.9 19.0 3.6 Complete parts (a) through (e), given Ex = 112.8, Zy = 32.6, [x2 = 2170.1, Ey2 = 292.9, Exy = 668.49, and r = 0.735. (a) Draw a scatter diagram displaying the data. Graph Layers -13 12 After you add an object to the graph you can use Graph Layers to view and edit its properties. 10 Fill . . No Solution Help 15 20 23 25 WebAssign. Graphing Tool (b) Verify the given sums Ex, Zy, Ex2, Zy2, Exy, and the value of the sample correlation coefficient r. (Round your value for r to three decimal places.) Ex = Zy = Ex2 = Ey2 = Exy 1 = (c) Find x, and y. Then find the equation of the least- squares line , = a + bx. (Round your answers for x and y to two decimal places. Round your answers for a and b to three decimal places.) X = y = V =6. [-/0.3 Points] DETAILS BBUNDERSTAT12 9.2.009.NVA MY NOTES ASK YOUR TEACHER PRACTICE ANOTHER Do heavier cars really use more gasoline? Suppose a car is chosen at random. Let x be the weight of the car (in hundreds of pounds), and let y be the miles per gallon (mpg). Complete parts (a) through (e), given Ex = 296, Zy = 168, Ex2 = 11,780, Zy2 = 3794, Exy = 5787, and /*-0914. (a) Draw a scatter diagram displaying the data. -35- Graph Layers After you add an object to the graph you can use Graph Layers to view and edit its properties. 25 Fill | 20 . 15 No Solution -10 Help 20 25 30 45 60 WebAssign. Graphing Tool (b) Verify the given sums Ex, Zy, Ex2, Zy2, Exy, and the value of the sample correlation coefficient r. (Round your value for r to three decimal places.) Ex = Zy = [x2 = Ey2 Exy = (c) Find x, and y. Then find the equation of the least- squares line , = a + bx. (Round your answers for x and y to two decimal places. Round your answers for a and b to three decimal places.) X = y =5. [-/0.3 Points] DETAILS BBUNDERSTAT12 9.2.008.NVA MY NOTES ASK YOUR TEACHER PRACTICE ANOTHER You are the foreman of the Bar-S cattle ranch in Colorado. A neighboring ranch has calves for sale, and you are going to buy some calves to add to the Bar-S herd. How much should a healthy calf weigh? Let x be the age of the calf (in weeks), and let y be the weight of the calf (in kilograms). 150 200 Complete parts (a) through (e), given Ex = 95, Zy = 614, Ex2 = 2357, Ey2 = 82,044, Exy = 13,764, and r = 0.999. (a) Draw a scatter diagram displaying the data. 210 Graph Layers 200- After you add an object to the graph you can use Graph Layers to view and edit its 470- properties. 460- Fill . I.C 120- No 100 Solution $8 8 8 8 Help WebAssign. Graphing Tool (b) Verify the given sums Ex, Zy, Ex2, Zy2, Exy, and the value of the sample correlation coefficient r. (Round your value for r to three decimal places.) Ex = Zy = Ex2 = Ey2 Exy r = (c) Find x, and y. Then find the equation of the least- squares line , = a + bx. (Round your answers for x and y to two decimal places. Round your answers for a and b to three decimal places.) X = y =4. [-/0.3 Points] DETAILS BBUNDERSTAT12 9.2.007.NVA MY NOTES ASK YOUR TEACHER PRACTICE ANOTHER An economist is studying the job market in Denver area neighborhoods. Let x represent the total number of jobs in a given neighborhood, and let y represent the number of entry- level jobs in the same neighborhood. A sample of six Denver neighborhoods gave the following information (units in hundreds of jobs). * 13 35 48 28 50 25 Complete parts (a) through (e), given Ex = 199, Zy = 27, Ex2 = 7607, Ey2 = 153, Exy = 1014, and r = 0.665. (a) Draw a scatter diagram displaying the data. 10- Graph Layers After you add an object to the graph you can use Graph Layers to view and edit its properties. Fill No Solution -2 Help 10 15 20 25 30 35 40 45 50 55 WebAssign. Graphing Tool (b) Verify the given sums Ex, Zy, Ex2, Ey2, Exy, and the value of the sample correlation coefficient r. (Round your value for r to three decimal places.) Ex = Ey = Ex2 = Ey 2 Exy= r= (c) Find x, and y. Then find the equation of the least- squares line , = a + bx. (Round your answers for x and y to two decimal places. Round your answers for a and b to three decimal places.) X = y =3. [40.3 Points] BBUNDERSTAT129.2.006. The following Minitab display gives information regarding the relationship between the body weight of a child (in kilograms) and the metabolic rate of the child (in 100 kcal/ 24 hr). Predictor Cue! SE Care! '1' P C nnnnnnn 0.8300 0.4148 2.06 0.8-! S = 0.517508 RSq = 94.31\": (a) Write out the least-squares equation. 9= M I)' (b) For each 'I kilogram increase in weight, how much does the metabolic rate of a child increase? (Use 5 decimal places.) (c) What is the value of the correlation coefcient r? (Use 3 decimal places.) ll 2. [-/0.3 Points] DETAILS BBUNDERSTAT12 9.2.005.MI. MY NOTES ASK YOUR TEACHER PRACTICE ANOTHER We use the form ,=a+ bx for the least-squares line. In some computer printouts, the least-squares equation is not given directly. Instead, the value of the constant a is given, and the coefficient b of the explanatory or predictor variable is displayed. Sometimes a is referred to as the constant, and sometimes as the intercept. Data from a report showed the following relationship between elevation (in thousands of feet) and average number of frost-free days per year in a state. A Minitab printout provides the following information. Predictor Coef SE Coef Constant 318 . 78 28 . 31 11.24 0 . 002 Elevation - 29 . 382 3 . 511 - 8. 79 0. 003 S = 11. 8603 R- Sq = 95. 2% Notice that "Elevation" is listed under "Predictor." This means that elevation is the explanatory variable x. Its coefficient is the slope b. "Constant" refers to a in the equation ,= a+bx. (a) Use the printout to write the least-squares equation. (b) For each 1000-foot increase in elevation, how many fewer frost-free days are predicted? (Round your answer to three decimal places.) (c) The printout gives the value of the coefficient of determination . What is the value of r? Be sure to give the correct sign for r based on the sign of b. (Round your answer to four decimal places.) (d) What percentage of the variation in y can be explained by the corresponding variation in x and the least-squares line? % What percentage is unexplained? %
Step by Step Solution
There are 3 Steps involved in it

Get step-by-step solutions from verified subject matter experts