

Question: Please solve a) to i) according to the graph given using Microsoft Excel and provide Excel screenshot You have been asked to analyze two mutually
Please solve a) to i) according to the graph given using Microsoft Excel and provide Excel screenshot
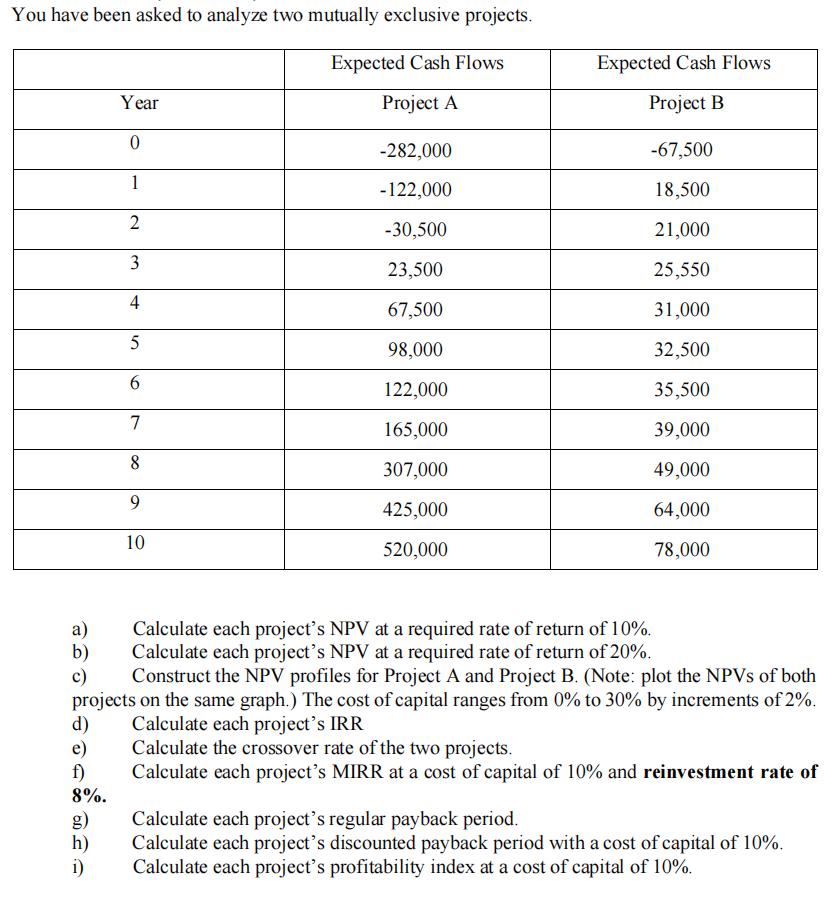
You have been asked to analyze two mutually exclusive projects. Expected Cash Flows Project A a) b) c) Year 0 1 2 3 4 5 6 7 8 9 10 d) e) f) 8%. g) h) i) -282,000 -122,000 -30,500 23,500 67,500 98,000 122,000 165,000 307,000 425,000 520,000 Calculate each project's NPV at a required rate of return of 10%. Calculate each project's NPV at a required rate of return of 20%. Construct the NPV profiles for Project A and Project B. (Note: plot the NPVs of both projects on the same graph.) The cost of capital ranges from 0% to 30% by increments of 2%. Calculate each project's IRR Calculate the crossover rate of the two projects. Calculate each project's MIRR at a cost of capital of 10% and reinvestment rate of Expected Cash Flows Project B -67,500 18,500 21,000 25,550 31,000 32,500 35,500 39,000 49,000 64,000 78,000 Calculate each project's regular payback period. Calculate each project's discounted payback period with a cost of capital of 10%. Calculate each project's profitability index at a cost of capital of 10%.
Step by Step Solution
3.54 Rating (161 Votes )
There are 3 Steps involved in it
a Calculate each projects NPV at a required rate of return of 10 Project A Year 0 282000 Year 1 1850... View full answer

Get step-by-step solutions from verified subject matter experts