

Question: Please solve all the 4 ques with proper reasoning and step by step numericals. Write-up: This write-up is expected to be different from the first
Please solve all the 4 ques with proper reasoning and step by step numericals.
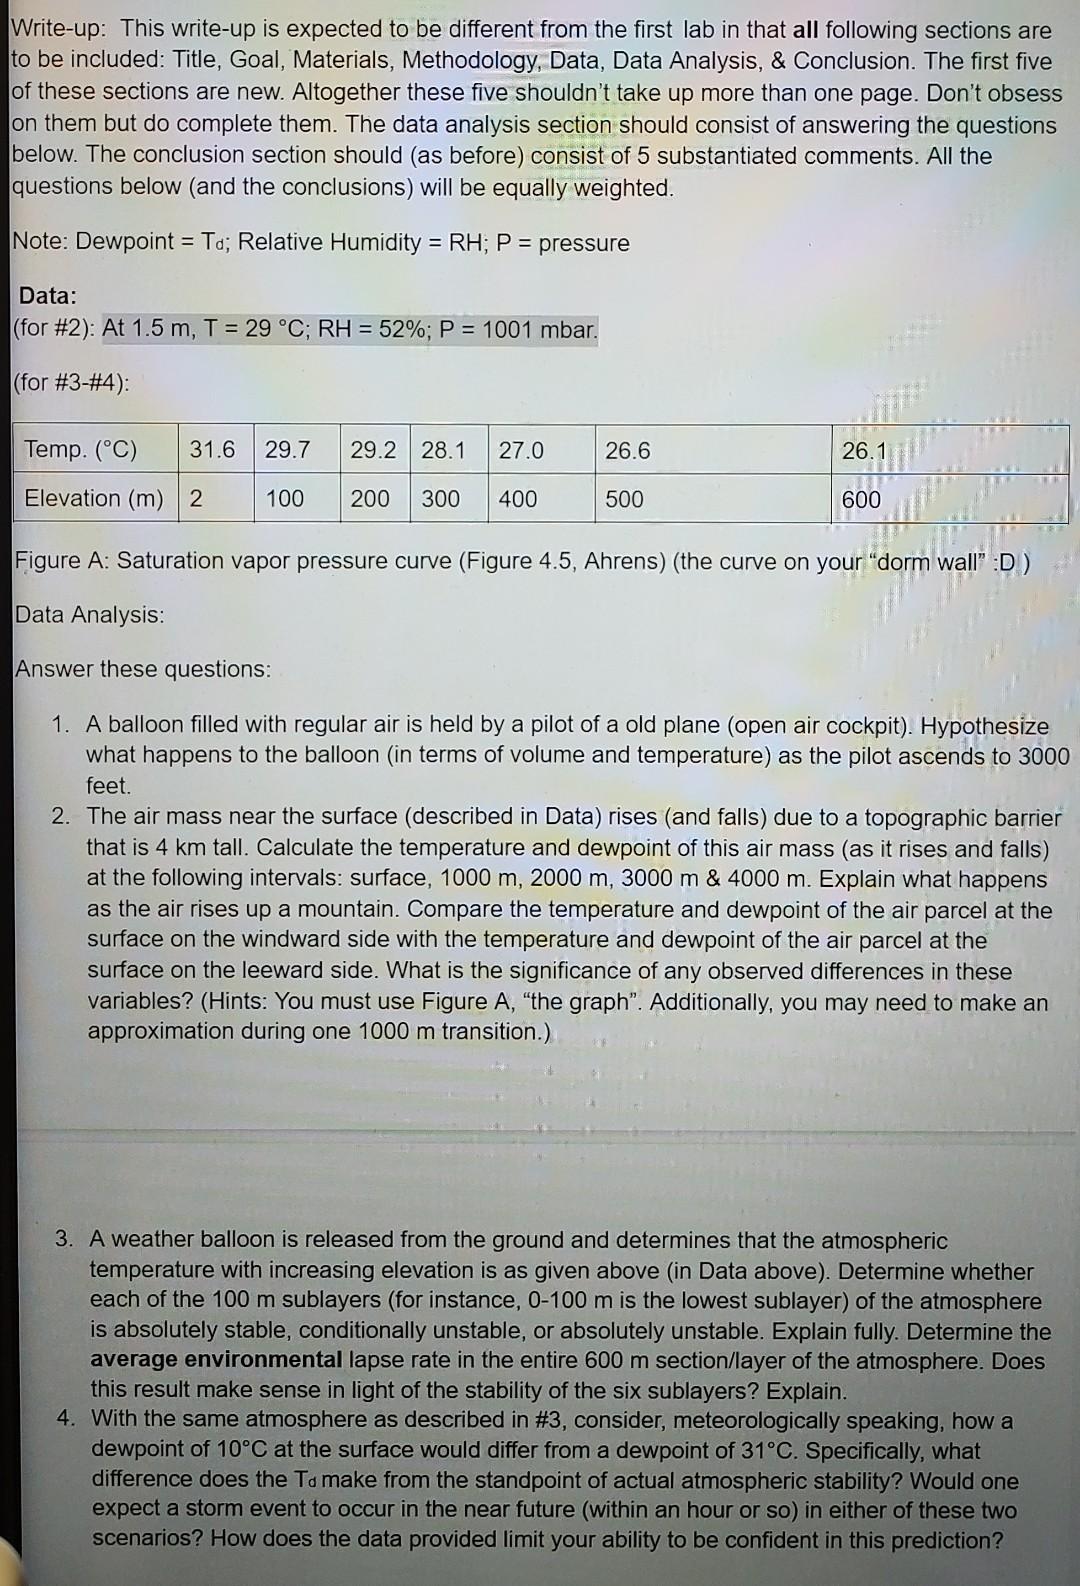
Write-up: This write-up is expected to be different from the first lab in that all following sections are to be included: Title, Goal, Materials, Methodology, Data, Data Analysis, & Conclusion. The first five of these sections are new. Altogether these five shouldn't take up more than one page. Don't obsess on them but do complete them. The data analysis section should consist of answering the questions below. The conclusion section should (as before) consist of 5 substantiated comments. All the questions below (and the conclusions) will be equally weighted. Note: Dewpoint = Td; Relative Humidity = RH; P = pressure Data: (for #2): At 1.5 m, T = 29 C; RH = 52%; P = 1001 mbar. (for #3-#4) Temp. (C) 31.6 29.7 29.2 28.1 27.0 26.6 26.1 Elevation (m) 2 100 200 300 400 500 600 Figure A: Saturation vapor pressure curve (Figure 4.5, Ahrens) (the curve on your "dorm wall" :D ) Data Analysis: Answer these questions: 1. A balloon filled with regular air is held by a pilot of a old plane (open air cockpit). Hypothesize what happens to the balloon (in terms of volume and temperature) as the pilot ascends to 3000 feet. 2. The air mass near the surface (described in Data) rises (and falls) due to a topographic barrier that is 4 km tall. Calculate the temperature and dewpoint of this air mass (as it rises and falls) at the following intervals: surface, 1000 m, 2000 m, 3000 m & 4000 m. Explain what happens as the air rises up a mountain. Compare the temperature and dewpoint of the air parcel at the surface on the windward side with the temperature and dewpoint of the air parcel at the surface on the leeward side. What is the significance of any observed differences in these variables? (Hints: You must use Figure A, "the graph. Additionally, you may need to make an approximation during one 1000 m transition.) 3. A weather balloon is released from the ground and determines that the atmospheric temperature with increasing elevation is as given above (in Data above). Determine whether each of the 100 m sublayers (for instance, 0-100 m is the lowest sublayer) of the atmosphere is absolutely stable, conditionally unstable, or absolutely unstable. Explain fully. Determine the average environmental lapse rate in the entire 600 m section/layer of the atmosphere. Does this result make sense in light of the stability of the six sublayers? Explain. 4. With the same atmosphere as described in #3, consider, meteorologically speaking, how a dewpoint of 10C at the surface would differ from a dewpoint of 31C. Specifically, what difference does the Ta make from the standpoint of actual atmospheric stability? Would one expect a storm event to occur in the near future (within an hour or so) in either of these two scenarios? How does the data provided limit your ability to be confident in this prediction
Step by Step Solution
There are 3 Steps involved in it

Get step-by-step solutions from verified subject matter experts