

Question: please solve all the questions .3-2 Question Help ormal probability plot shown below, the correlation between the random variable X and expected z-scores is 0.967.
please solve all the questions
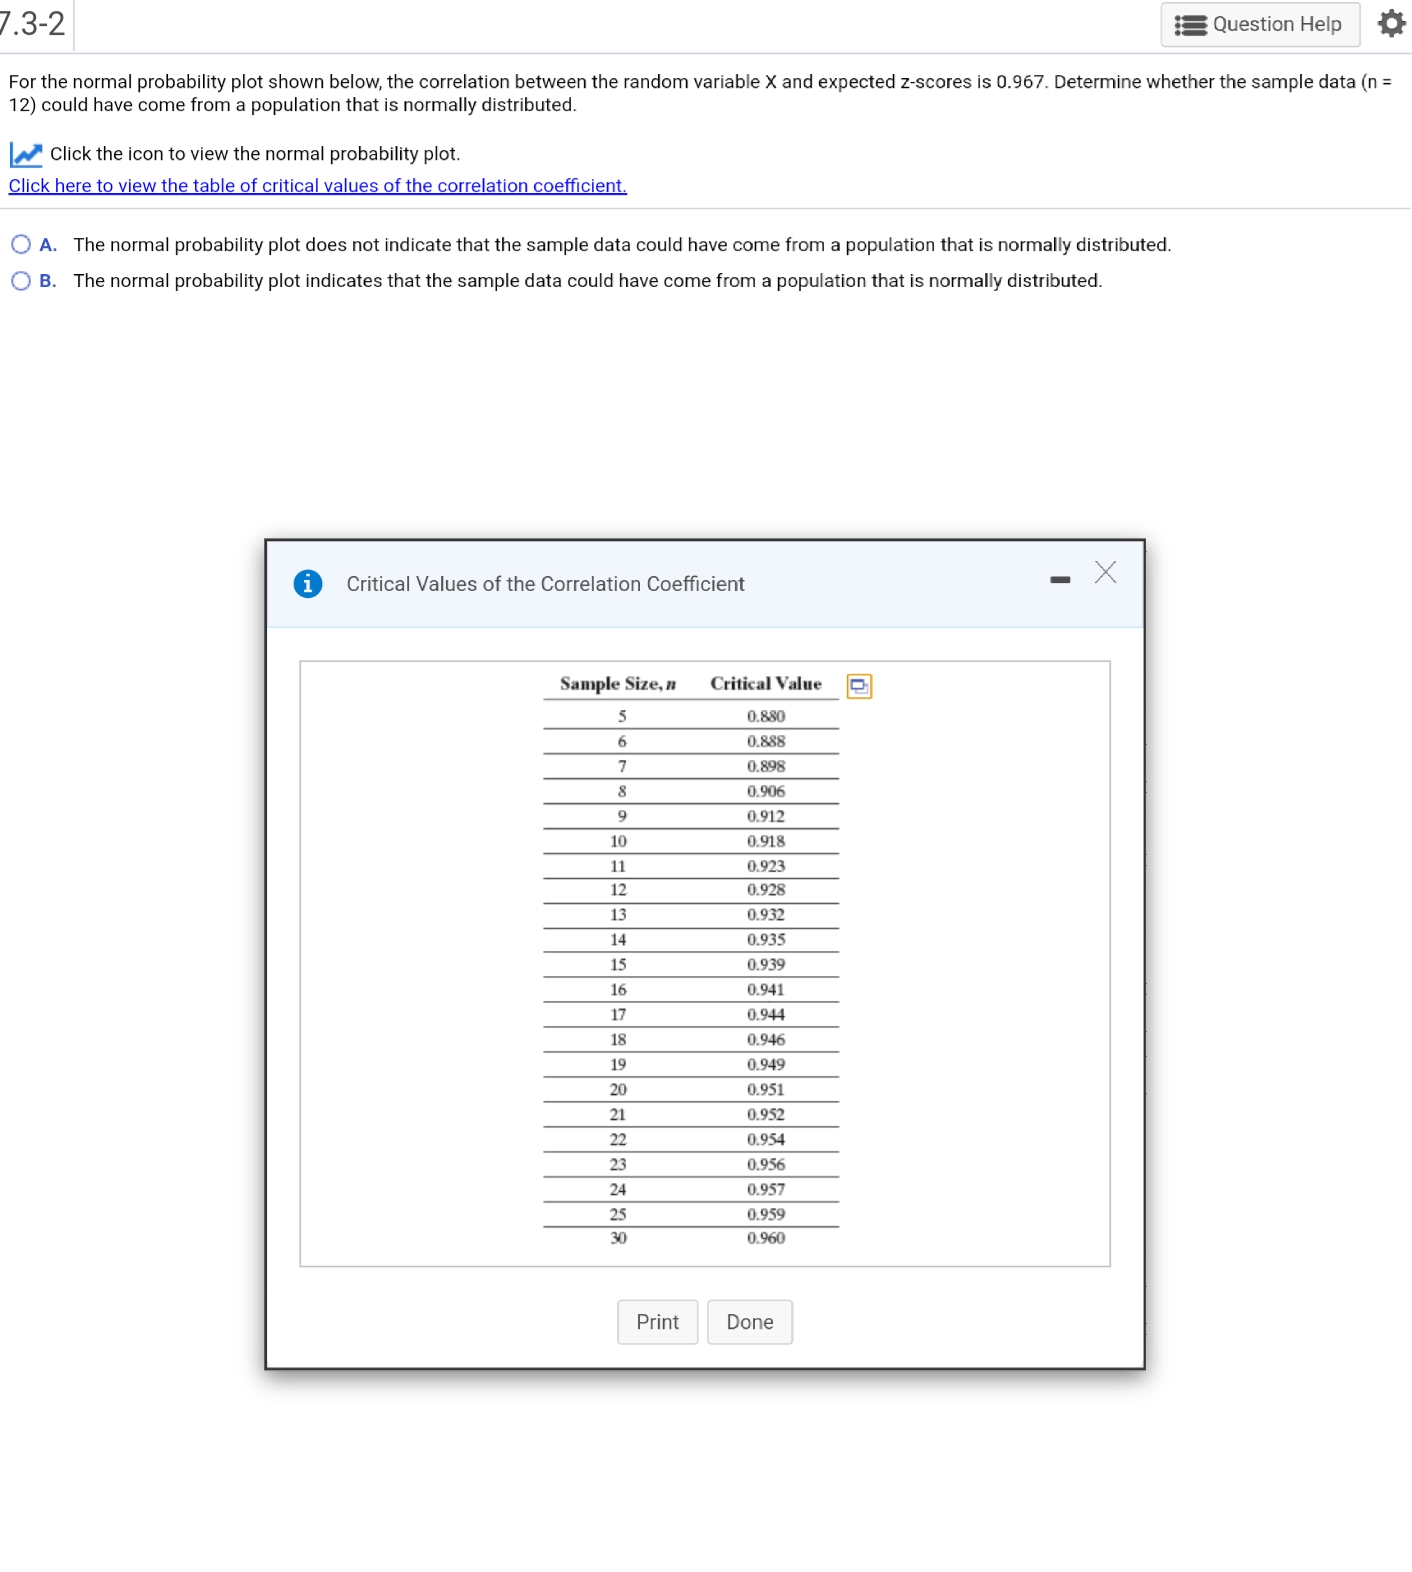
.3-2 Question Help ormal probability plot shown below, the correlation between the random variable X and expected z-scores is 0.967. Determine whether the sample data (n = 12) could have come from a population that is normally distributed. Click the icon to view the normal probability plot. Click here to view the table of critical values of the correlation coefficient. O A. The normal probability plot does not indicate that the sample data could have come from a population that is normally distributed. O B. The normal probability plot indicates that the sample data could have come from a population that is normally distributed. Critical Values of the Correlation Coefficient - X Sample Size, n Critical Value 5 0.880 0.888 0.898 0.906 0.912 0.918 0.923 0.928 0.932 0.935 0.939 0.941 0.944 0.946 6+60 0.951 0.952 0.954 0.956 0.957 0.959 0.960 Print Done
Step by Step Solution
There are 3 Steps involved in it

Get step-by-step solutions from verified subject matter experts