

Question: Please solve and add work CIRCLE GRAPH ANALYSIS 5. If the Smith family has a $1300 budget, then $455 will be spent on housing. True
Please solve and add work
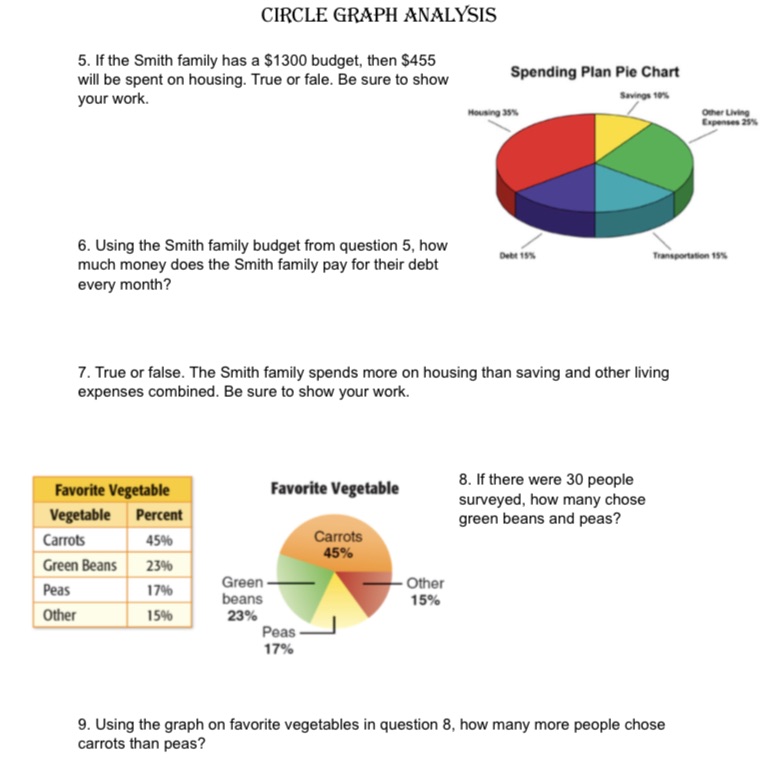
CIRCLE GRAPH ANALYSIS 5. If the Smith family has a $1300 budget, then $455 will be spent on housing. True or fale. Be sure to show Spending Plan Pie Chart your work. Savings 19% ser Busnow Other Living Expenses 29% 6. Using the Smith family budget from question 5, how Debt 15% much money does the Smith family pay for their debt every month? 7. True or false. The Smith family spends more on housing than saving and other living expenses combined. Be sure to show your work. Favorite Vegetable Favorite Vegetable 8. If there were 30 people surveyed, how many chose Vegetable Percent green beans and peas? Carrots 45% Carrots 45% Green Beans 23% Peas 1796 Green Other beans 15% Other 15% 23% Peas 17% 9. Using the graph on favorite vegetables in question 8, how many more people chose carrots than peas
Step by Step Solution
There are 3 Steps involved in it

Get step-by-step solutions from verified subject matter experts