

Question: Please solve and let me know if i am correct. thanks! Consider the planned aggregate expenditure lines in the figure on the left: cick to
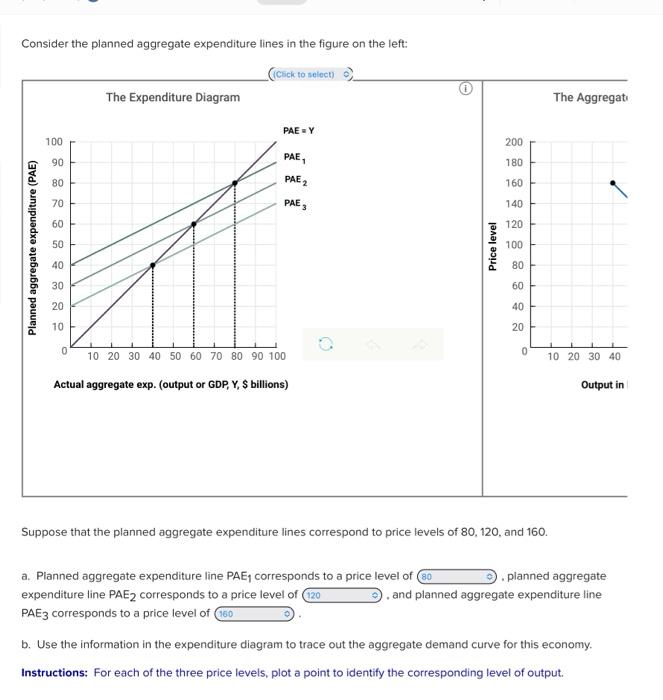
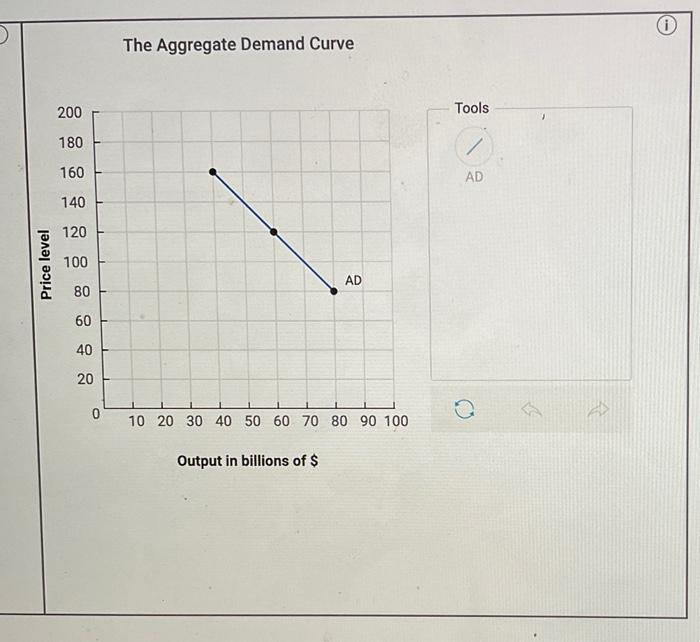
Consider the planned aggregate expenditure lines in the figure on the left: cick to select The Expenditure Diagram The Aggregat PAEY 100 200 90 PAE PAE 2 180 80 160 70 PAES 140 60 120 Planned aggregate expenditure (PAE) 50 Price level 100 40 80 30 60 20 40 10 20 0 0 10 20 30 40 50 60 70 80 90 100 10 20 30 40 Actual aggregate exp. (output or GDP, Y, $ billions) Output in Suppose that the planned aggregate expenditure lines correspond to price levels of 80, 120, and 160. a. Planned aggregate expenditure line PAE, corresponds to a price level of 80 planned aggregate expenditure line PAE2 corresponds to a price level of 120 and planned aggregate expenditure line PAE3 corresponds to a price level of 160 b. Use the information in the expenditure diagram to trace out the aggregate demand curve for this economy. Instructions: For each of the three price levels, plot a point to identify the corresponding level of output. The Aggregate Demand Curve 200 Tools 180 160 AD 140 120 Price level 100 AD 80 60 40 20 0 o 10 20 30 40 50 60 70 80 90 100 Output in billions of $
Step by Step Solution
There are 3 Steps involved in it

Get step-by-step solutions from verified subject matter experts