

Question: Please solve and show work. a. Find the solution that minimizes moving costs using Microsoft Excel. b. What would you have to do to the
Please solve and show work. 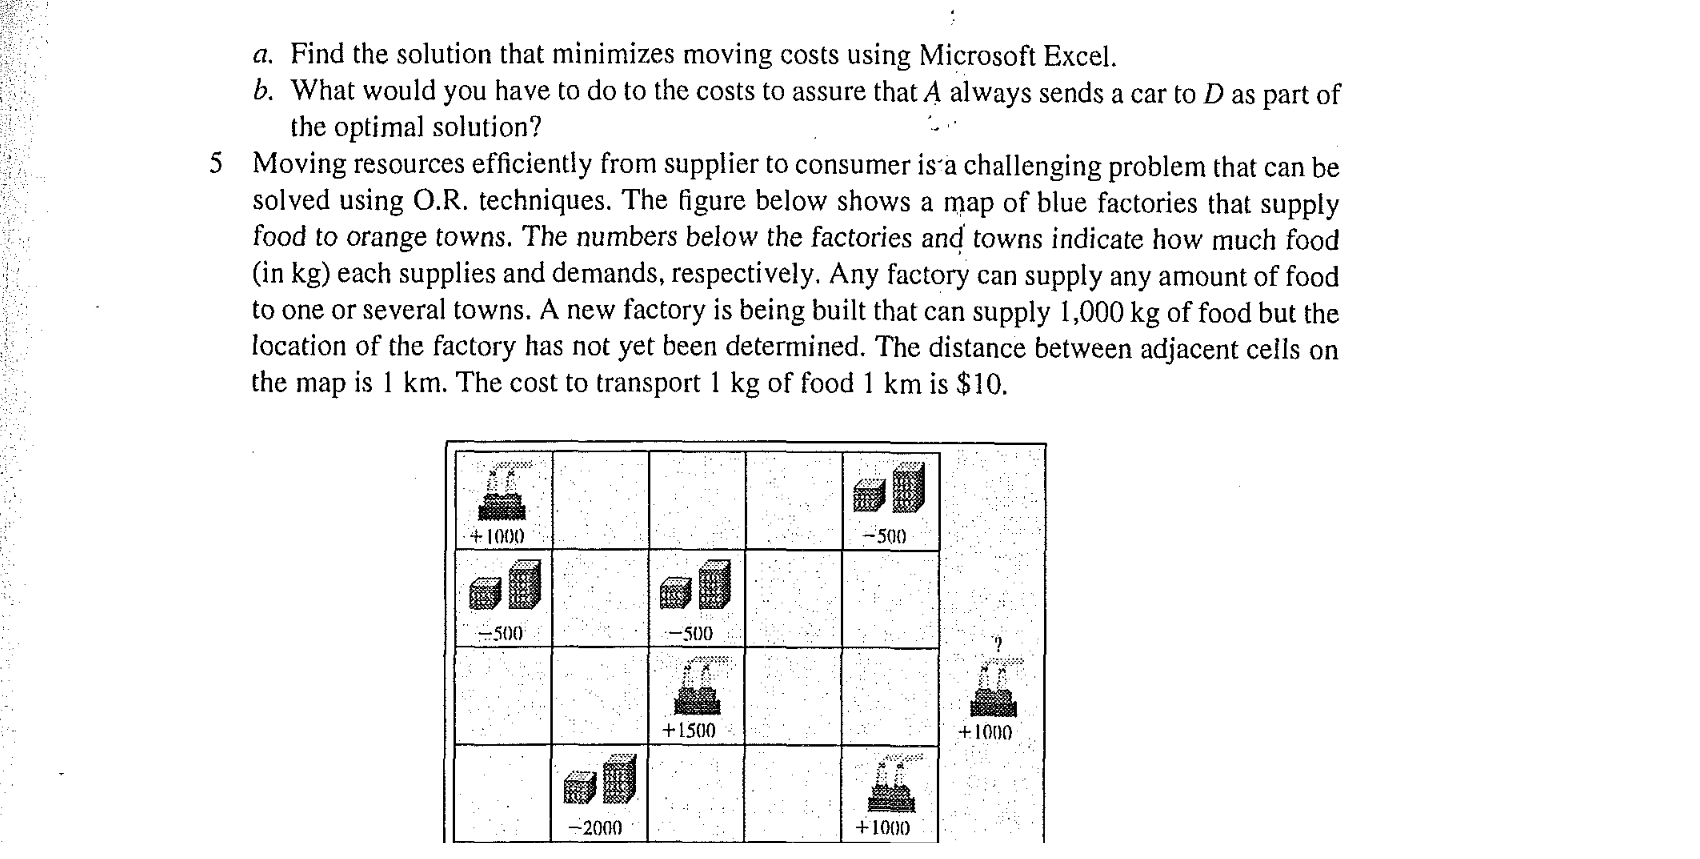
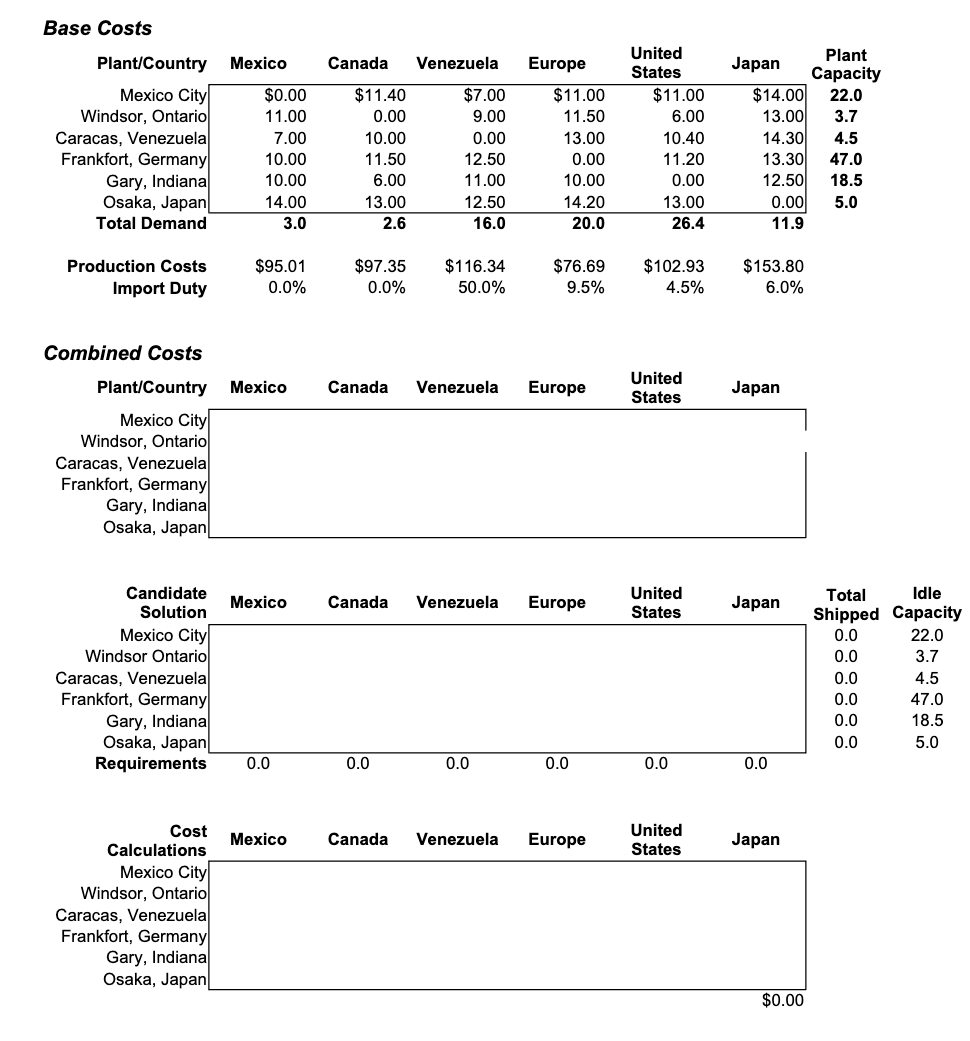
a. Find the solution that minimizes moving costs using Microsoft Excel. b. What would you have to do to the costs to assure that A always sends a car to D as part of the optimal solution? 5 Moving resources efficiently from supplier to consumer is a challenging problem that can be solved using O.R. techniques. The figure below shows a map of blue factories that supply food to orange towns. The numbers below the factories and towns indicate how much food (in kg ) each supplies and demands, respectively. Any factory can supply any amount of food to one or several towns. A new factory is being built that can supply 1,000kg of food but the location of the factory has not yet been determined. The distance between adjacent cells on the map is 1km. The cost to transport 1kg of food 1km is $10. Base Costs \begin{tabular}{rrrrrrrr|r} Plant/Country & Mexico & Canada & Venezuela & Europe & \multicolumn{2}{l}{UnitedStates} & Japan & PlantCapacity \\ \cline { 4 - 9 } Mexico City & $0.00 & $11.40 & $7.00 & $11.00 & $11.00 & $14.00 & 22.0 \\ Windsor, Ontario & 11.00 & 0.00 & 9.00 & 11.50 & 6.00 & 13.00 & 3.7 \\ Caracas, Venezuela & 7.00 & 10.00 & 0.00 & 13.00 & 10.40 & 14.30 & 4.5 \\ Frankfort, Germany & 10.00 & 11.50 & 12.50 & 0.00 & 11.20 & 13.30 & 47.0 \\ Gary, Indiana & 10.00 & 6.00 & 11.00 & 10.00 & 0.00 & 12.50 & 18.5 \\ Osaka, Japan & 14.00 & 13.00 & 12.50 & 14.20 & 13.00 & 0.00 & 5.0 \\ Total Demand & 3.0 & 2.6 & 16.0 & 20.0 & 26.4 & 11.9 \\ Production Costs & $95.01 & $97.35 & $116.34 & $76.69 & $102.93 & $153.80 \\ Import Duty & 0.0% & 0.0% & 50.0% & 9.5% & 4.5% & 6.0% \end{tabular} Combined Costs a. Find the solution that minimizes moving costs using Microsoft Excel. b. What would you have to do to the costs to assure that A always sends a car to D as part of the optimal solution? 5 Moving resources efficiently from supplier to consumer is a challenging problem that can be solved using O.R. techniques. The figure below shows a map of blue factories that supply food to orange towns. The numbers below the factories and towns indicate how much food (in kg ) each supplies and demands, respectively. Any factory can supply any amount of food to one or several towns. A new factory is being built that can supply 1,000kg of food but the location of the factory has not yet been determined. The distance between adjacent cells on the map is 1km. The cost to transport 1kg of food 1km is $10. Base Costs \begin{tabular}{rrrrrrrr|r} Plant/Country & Mexico & Canada & Venezuela & Europe & \multicolumn{2}{l}{UnitedStates} & Japan & PlantCapacity \\ \cline { 4 - 9 } Mexico City & $0.00 & $11.40 & $7.00 & $11.00 & $11.00 & $14.00 & 22.0 \\ Windsor, Ontario & 11.00 & 0.00 & 9.00 & 11.50 & 6.00 & 13.00 & 3.7 \\ Caracas, Venezuela & 7.00 & 10.00 & 0.00 & 13.00 & 10.40 & 14.30 & 4.5 \\ Frankfort, Germany & 10.00 & 11.50 & 12.50 & 0.00 & 11.20 & 13.30 & 47.0 \\ Gary, Indiana & 10.00 & 6.00 & 11.00 & 10.00 & 0.00 & 12.50 & 18.5 \\ Osaka, Japan & 14.00 & 13.00 & 12.50 & 14.20 & 13.00 & 0.00 & 5.0 \\ Total Demand & 3.0 & 2.6 & 16.0 & 20.0 & 26.4 & 11.9 \\ Production Costs & $95.01 & $97.35 & $116.34 & $76.69 & $102.93 & $153.80 \\ Import Duty & 0.0% & 0.0% & 50.0% & 9.5% & 4.5% & 6.0% \end{tabular} Combined Costs
Step by Step Solution
There are 3 Steps involved in it

Get step-by-step solutions from verified subject matter experts