

Question: Please solve as much as you can. I will up-vote you life-time. Al Anwar Ceramic Tiles Company SAOG Statement of profit or loss and other
Please solve as much as you can. I will up-vote you life-time.
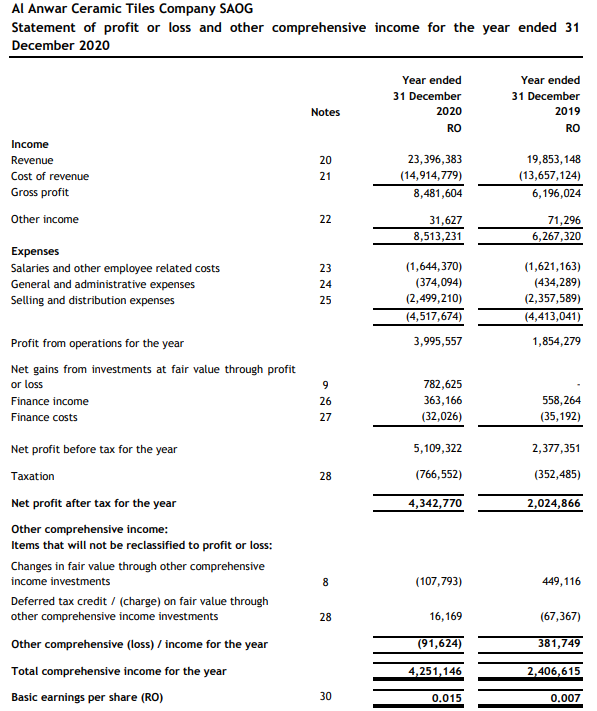
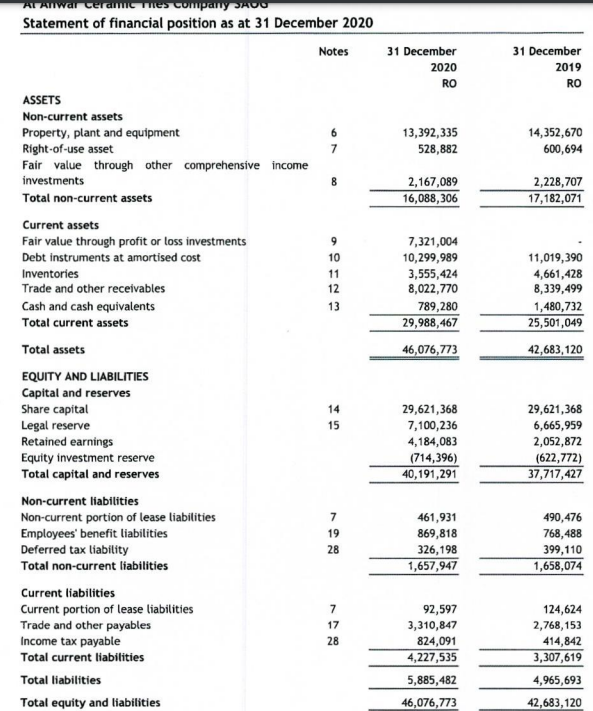
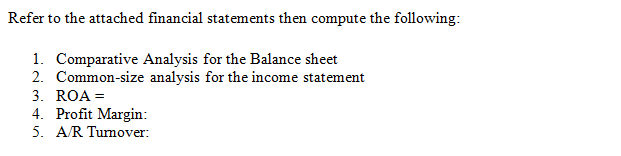
Al Anwar Ceramic Tiles Company SAOG Statement of profit or loss and other comprehensive income for the year ended 31 December 2020 Year ended 31 December 2020 RO Year ended 31 December 2019 RO Notes 20 21 23,396,383 (14,914,779) 8,481,604 19,853,148 (13,657,124) 6,196,024 22 Income Revenue Cost of revenue Gross profit Other income Expenses Salaries and other employee related costs General and administrative expenses Selling and distribution expenses 31,627 8,513,231 71,296 6,267,320 23 24 25 (1,644,370) (374,094) (2,499,210) (4,517,674) (1,621,163) (434,289) (2,357,589) (4,413,041) 1,854,279 3,995,557 Profit from operations for the year Net gains from investments at fair value through profit or loss Finance income Finance costs 9 26 27 782,625 363,166 (32,026) 558,264 (35,192) 5,109,322 2,377,351 28 (766,552) (352,485) 4,342,770 2,024,866 Net profit before tax for the year Taxation Net profit after tax for the year Other comprehensive income: Items that will not be reclassified to profit or loss: Changes in fair value through other comprehensive income investments Deferred tax credit / (charge) on fair value through other comprehensive income investments Other comprehensive (Loss) / income for the year Total comprehensive income for the year Basic earnings per share (RO) 8 (107,793) 449, 116 28 16, 169 (67,367) (91,624) 381,749 2,406,615 4,251,146 0.015 30 0.007 AT Anwar ceramiches company A00 Statement of financial position as at 31 December 2020 Notes 31 December 2020 RO 31 December 2019 RO 13,392,335 528,882 14,352,670 600,694 7 8 2,167,089 16,088,306 2,228,707 17,182,071 9 10 11 12 13 7,321,004 10,299,989 3,555,424 8,022,770 789,280 29,988,467 46,076,773 11,019,390 4,661,428 8,339,499 1,480,732 25,501,049 42,683,120 ASSETS Non-current assets Property, plant and equipment Right-of-use asset Fair value through other comprehensive income investments Total non-current assets Current assets Fair value through profit or loss investments Debt instruments at amortised cost Inventories Trade and other receivables Cash and cash equivalents Total current assets Total assets EQUITY AND LIABILITIES Capital and reserves Share capital Legal reserve Retained earnings Equity investment reserve Total capital and reserves Non-current liabilities Non-current portion of lease liabilities Employees' benefit liabilities Deferred tax liability Total non-current liabilities Current liabilities Current portion of lease liabilities Trade and other payables Income tax payable Total current liabilities Total liabilities Total equity and liabilities 14 15 29,621,368 7,100,236 4,184,083 (714,396) 40,191,291 29,621,368 6,665,959 2,052,872 (622,772) 37,717,427 7 19 28 461,931 869,818 326,198 1,657,947 490,476 768,488 399,110 1,658,074 7 17 28 92,597 3,310,847 824,091 4,227,535 5,885,482 124,624 2,768,153 414,842 3,307,619 4,965,693 42,683, 120 46,076,773 Refer to the attached financial statements then compute the following: 1. Comparative Analysis for the Balance sheet 2. Common-size analysis for the income statement 3. ROA = 4. Profit Margin: 5. A/R Turnover
Step by Step Solution
There are 3 Steps involved in it

Get step-by-step solutions from verified subject matter experts