

Question: please solve both Your process uses a tool to form a critical dimension, and this tool has cracked, causing a change in the critical dimension.
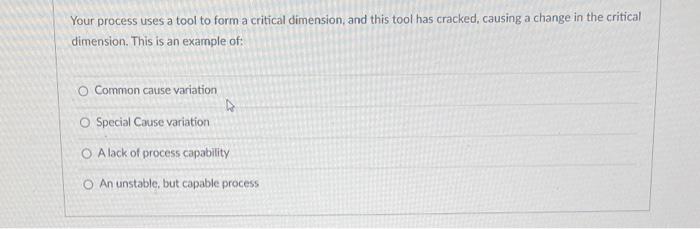
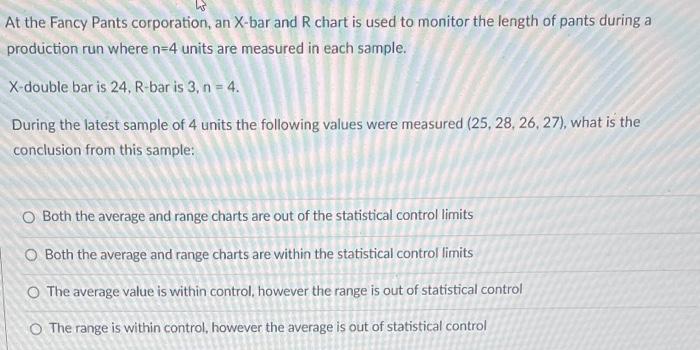
Your process uses a tool to form a critical dimension, and this tool has cracked, causing a change in the critical dimension. This is an example of: Common cause variation Special Cause variation Alack of process capability An unstable, but capable process At the Fancy Pants corporation, an X-bar and R chart is used to monitor the length of pants during a production run where n=4 units are measured in each sample. X-double bar is 24,R-bar is 3,n=4. During the latest sample of 4 units the following values were measured (25,28,26,27), what is the conclusion from this sample: Both the average and range charts are out of the statistical control limits Both the average and range charts are within the statistical control limits The average value is within control, however the range is out of statistical control The range is within control, however the average is out of statistical control
Step by Step Solution
There are 3 Steps involved in it

Get step-by-step solutions from verified subject matter experts